
Activity Monitor is the Mac equivalent of the Windows Task Manager. It displays a variety of resources in use on your system in real-time. These include processes, disk activity, memory usage, and more to provide a sort of dashboard into what’s going on in your Mac.
We’ll show you how to read and use Activity Monitor. You’ll also learn how CPU, RAM, and disk activity can affect your Mac’s performance over time.
How to Open Activity Monitor on Mac
The Activity Monitor app lives in Applications > Utilities. Navigate to this folder and double-click the icon to launch the app.
However, you can get to this (or any Mac app) much faster using Spotlight search. Press Cmd + Space to open Spotlight. Then type in the first few letters of the app and press Return.

You may find it convenient to pin Activity Monitor in your Dock. Right-click the app icon and choose Options > Keep in Dock. You can even monitor vital parameters right from the Dock. Choose View > Dock Icon and select Show CPU Usage or History.

Basics of Activity Monitor
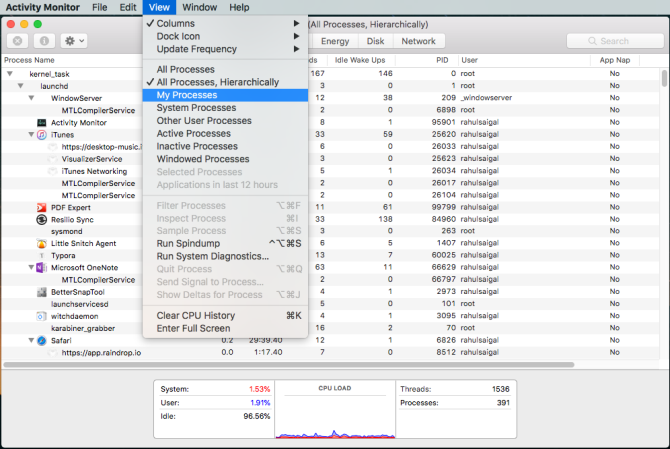
The main window of the app is the principal process monitor. It displays a list of both open apps and system processes. Some apps are easy to spot, while others are system-level processes essential for running macOS.
Click the column header at the top to arrange the processes in either ascending or descending order. On the upper-right, there is a Search Filter box which lets you search for a specific process.

The five category tabs at the top of the window (CPU, Memory, Energy, Disk, and Network) focus on specific kinds of data. They’re the primary system monitor indicators and gives you a lot of valuable information for troubleshooting purposes. Each pane shows real-time stats and graphs of resource usage over time.
By default, Activity Monitor shows only processes running for the currently logged-in user. To change this, choose View > All Processes. You can also adjust the number of statistics shown in the columns and the update frequency.
Monitor CPU With Activity Monitor
The CPU tab shows how every process uses your computer’s processor. You’ll see what percentage of the total CPU a process is using (% CPU), how long it’s been active (CPU Time), number of times a process awoke from the sleep state (Idle Wake Ups), and more.
At the bottom, you’ll also see the percentage and graph of your CPU used by the System (red) and User (blue).

List processes by %CPU
To see which processes are consuming excessive resources, choose View > All Processes and click on the % CPU column to sort them by usage. Some processes may occasionally display high CPU usage, but that doesn’t necessarily indicate a problem. For example:
- The mds and mdworker processes associated with Spotlight might show frequent CPU spikes during indexing. This is perfectly normal for a new or recently formatted Mac. The process will end automatically when done.
- The kernel_task process uses a large amount of CPU. It helps manage your Mac’s temperature by limiting CPU access to processes that use the CPU intensely. It’s common to see this consume more CPU over time. Thankfully, you can fix “kernel_task” high CPU usage on your Mac.
- A web browser may show high CPU usage while rendering too many tabs or displaying multimedia content like video.
Quit Rogue Processes
If an app is acting weird, becomes unresponsive, or crashes, then your best option is to force-quit the app. In Activity Monitor, you may see problematic processes in red text with the phrase Not Responding.
To terminate the process, select the app and choose View > Quit Process. Or click the X button at the top of the toolbar to quit the process.

If Activity Monitor is not working for some reason, then try these alternative steps:
- Press and hold Cmd + Option + Esc. Choose the app you want to quit in the Force Quit Applications dialog box and click Force Quit.
- Open the Terminal app. Type
>ps -axthen press Return to list all the running process along with PID (Process Identification) number. To force quit an app, type>kill <PID number>.
Note: You should never force-quit system processes, or ignore processes that run as root. Instead, find out the probable cause by looking at logs or restarting your Mac to see if the problem vanishes.
The Memory Tab in Activity Monitor
The Memory tab displays how much RAM your Mac is using. Along with the CPU, it’s a chief performance indicator of your Mac. At the bottom of the window, you’ll see a real-time memory graph with values that can help you diagnose performance issues.
The Memory Used value is the total amount of memory used by all apps and system processes. It’s divided into the following:
- Wired Memory: Processes that must stay in memory. They can’t be compressed or paged out.
- App Memory: Memory allocated to all app processes.
- Compressed: macOS includes software-based memory compression to increase performance and reduce energy use. Your Mac compresses the content used by less active processes to free up space for more active ones.

Check If Your Mac Needs More RAM
The Memory Pressure graph shows the present state of memory resource usage through different colors. Green means sufficient memory resources are available, while Red means your Mac has run out of memory and needs more RAM to operate efficiently.
The borderline Yellow is a warning sign. Check to see if an app is using up memory and causing the memory pressure to increase. If that’s the case, then quit the app.
View Cached Files Memory Usage
Cached Files is another useful parameter. This tells you how much memory is presently used by apps, but available for other apps to take. For example, if you quit Apple Mail after using it for a while, its data will become part of the memory used by cached files.
If you re-launch the Mail app, it’ll launch faster. But if another app needs RAM, macOS will dynamically remove cached data and allocate it to other apps.
If Cached Files is consuming a lot of memory, don’t fret about it. As long as memory pressure is green, it shouldn’t be a concern. You might need more RAM in the future, but before that, check out some common mistakes that slow down your Mac.
The Swap Used and Compression Entries
These two parameters tell how much active process data was swapped out to startup drive or compressed to save space. Compression is preferred to swapping because it makes more room for memory and doesn’t slow down your Mac.
A low number for Swap Used is acceptable, but a high number indicates that your Mac doesn’t have enough real memory to meet the application demands.
Review Energy Usage With Activity Monitor
Every MacBook user has a valid concern about battery life; you probably want your laptop to run for as long as possible. The Energy pane of Activity Monitor is your Mac’s resource monitor. It shows overall energy use and power used by each app.
You’ll see the Energy Impact of running apps, along with the Avg Energy Impact of each app over the last eight hours or when your Mac booted up, whichever is shorter. The App Nap feature allows your Mac to put inactive apps to sleep—this field tells you which apps support this and whether it is preventing your Mac from going to sleep or not.

Implications of Energy Usage
The more energy a particular app uses, the lower your battery life becomes. At the most basic level, you must check the Avg Energy Impact column to see which apps use the most energy over time. Quit those apps if you don’t need them.
For web browsers, you don’t have to quit the entire app. Click the triangle next to the browser to expand the list of child processes. Find the one with the highest energy impact, then force-quit that process.

Generally, those are tabs or plugins that consume significant energy. If you’re using Chrome, check out how to control Chrome’s memory usage and free up RAM.
Activity Monitor’s Disk Panel
The Disk pane shows the amount of data each process has read from or written to the disk. It denotes the number of times your Mac accessed the drive to read (read IO) and write (write IO) data. The color blue shows the number of reads/sec while red indicates the number of writes/sec.

Implications of Disk Activity
Having enough RAM is essential for performance, but free space on your startup drive is critical for system stability. Pay close attention to the number of reads or writes and observe how your system accesses the read or write data.
If disk activity is high, does it correlate with the CPU usage? Some apps or processes can cause both heavy disk activity and CPU usage, like when you convert video or edit RAW photos. And if your Mac is short on RAM, you’ll see frequent spikes in disk activity due to swapping.
Using the Network Tab in Activity Monitor
The Network pane shows how much data your Mac is sending or receiving over your network. At the bottom, you’ll see network usage in packets and the amount transferred (in red) and received (in blue).

Implications of Network Activity
In the Activity Monitor, you can quickly identify apps that transmit lots of data. Some processes naturally generate a lot of network activity, but others using the network a lot might not make much sense. Determining which external resource each process is connecting to is a huge pain.
If you’re curious to see what data packets are passing through which processes, use the Little Snitch app to monitor network traffic on a per-app basis.
Generate a System Diagnostics Report
Activity Monitor can also help you generate a report about the status of your Mac. You can save the report and send it to a friend or Apple support for troubleshooting purposes.
To do this, choose View > System Diagnostics. Wait for a while for this to complete.

Benchmark Your Mac
Activity Monitor the stock macOS task manager. By running this tool and following the advice we’ve covered here, you can work out why your Mac is slow and what each parameter means to your overall system health.
If you just added new RAM or performance isn’t up to par, you can analyze your system performance with a series of tests. Have a look at these benchmark apps to measure your Mac’s performance.
Read the full article: What Is Activity Monitor? The Mac Equivalent of Task Manager
Read Full Article
No comments:
Post a Comment