30 October 2020

Background Features in Google Meet, powered by Web ML


Video conferencing is becoming ever more critical in people's work and personal lives. Improving that experience with privacy enhancements or fun visual touches can help center our focus on the meeting itself. As part of this goal, we recently announced ways to blur and replace your background in Google Meet, which use machine learning (ML) to better highlight participants regardless of their surroundings. Whereas other solutions require installing additional software, Meet’s features are powered by cutting-edge web ML technologies built with MediaPipe that work directly in your browser — no extra steps necessary. One key goal in developing these features was to provide real-time, in-browser performance on almost all modern devices, which we accomplished by combining efficient on-device ML models, WebGL-based rendering, and web-based ML inference via XNNPACK and TFLite.

Background blur and background replacement, powered by MediaPipe on the web.

Overview of Our Web ML Solution
The new features in Meet are developed with MediaPipe, Google's open source framework for cross-platform customizable ML solutions for live and streaming media, which also powers ML solutions like on-device real-time hand, iris and body pose tracking.

A core need for any on-device solution is to achieve high performance. To accomplish this, MediaPipe’s web pipeline leverages WebAssembly, a low-level binary code format designed specifically for web browsers that improves speed for compute-heavy tasks. At runtime, the browser converts WebAssembly instructions into native machine code that executes much faster than traditional JavaScript code. In addition, Chrome 84 recently introduced support for WebAssembly SIMD, which processes multiple data points using a single set of instructions, resulting in a performance boost of more than 2x.

Our solution first processes each video frame by segmenting a user from their background (more about our segmentation model later in the post) utilizing ML inference to compute a low resolution mask. Optionally, we further refine the mask to align it with the image boundaries. The mask is then used to render the video output via WebGL2, with the background blurred or replaced.

WebML Pipeline: All compute-heavy operations are implemented in C++/OpenGL and run within the browser via WebAssembly.

In the current version, model inference is executed on the client’s CPU for low power consumption and widest device coverage. To achieve real-time performance, we designed efficient ML models with inference accelerated by the XNNPACK library, the first inference engine specifically designed for the novel WebAssembly SIMD specification. Accelerated by XNNPACK and SIMD, the segmentation model can run in real-time on the web.

Enabled by MediaPipe's flexible configuration, the background blur/replace solution adapts its processing based on device capability. On high-end devices it runs the full pipeline to deliver the highest visual quality, whereas on low-end devices it continues to perform at speed by switching to compute-light ML models and bypassing the mask refinement.

Segmentation Model
On-device ML models need to be ultra lightweight for fast inference, low power consumption, and small download size. For models running in the browser, the input resolution greatly affects the number of floating-point operations (FLOPs) necessary to process each frame, and therefore needs to be small as well. We downsample the image to a smaller size before feeding it to the model. Recovering a segmentation mask as fine as possible from a low-resolution image adds to the challenges of model design.

The overall segmentation network has a symmetric structure with respect to encoding and decoding, while the decoder blocks (light green) also share a symmetric layer structure with the encoder blocks (light blue). Specifically, channel-wise attention with global average pooling is applied in both encoder and decoder blocks, which is friendly to efficient CPU inference.

Model architecture with MobileNetV3 encoder (light blue), and a symmetric decoder (light green).

We modified MobileNetV3-small as the encoder, which has been tuned by network architecture search for the best performance with low resource requirements. To reduce the model size by 50%, we exported our model to TFLite using float16 quantization, resulting in a slight loss in weight precision but with no noticeable effect on quality. The resulting model has 193K parameters and is only 400KB in size.

Rendering Effects
Once segmentation is complete, we use OpenGL shaders for video processing and effect rendering, where the challenge is to render efficiently without introducing artifacts. In the refinement stage, we apply a joint bilateral filter to smooth the low resolution mask.

Rendering effects with artifacts reduced. Left: Joint bilateral filter smooths the segmentation mask. Middle: Separable filters remove halo artifacts in background blur. Right: Light wrapping in background replace.

The blur shader simulates a bokeh effect by adjusting the blur strength at each pixel proportionally to the segmentation mask values, similar to the circle-of-confusion (CoC) in optics. Pixels are weighted by their CoC radii, so that foreground pixels will not bleed into the background. We implemented separable filters for the weighted blur, instead of the popular Gaussian pyramid, as it removes halo artifacts surrounding the person. The blur is performed at a low resolution for efficiency, and blended with the input frame at the original resolution.

Background blur examples.

For background replacement, we adopt a compositing technique, known as light wrapping, for blending segmented persons and customized background images. Light wrapping helps soften segmentation edges by allowing background light to spill over onto foreground elements, making the compositing more immersive. It also helps minimize halo artifacts when there is a large contrast between the foreground and the replaced background.

Background replacement examples.

Performance
To optimize the experience for different devices, we provide model variants at multiple input sizes (i.e., 256x144 and 160x96 in the current release), automatically selecting the best according to available hardware resources.

We evaluated the speed of model inference and the end-to-end pipeline on two common devices: MacBook Pro 18 with 2.2 GHz 6-Core Intel Core i7, and Acer Chromebook 11 with Intel Celeron N3060. For 720p input, the MacBook Pro can run the higher-quality model at 120 FPS and the end-to-end pipeline at 70 FPS, while the Chromebook runs inference at 62 FPS with the lower-quality model and 33 FPS end-to-end.

 Model   FLOPs   Device   Model Inference   Pipeline 
 256x144   64M   MacBook Pro 18   8.3ms (120 FPS)   14.3ms (70 FPS) 
 160x96   27M   Acer Chromebook 11   16.1ms (62 FPS)   30ms (33 FPS) 
Model inference speed and end-to-end pipeline on high-end (MacBook Pro) and low-end (Chromebook) laptops.

For quantitative evaluation of model accuracy, we adopt the popular metrics of intersection-over-union (IOU) and boundary F-measure. Both models achieve high quality, especially for having such a lightweight network:

  Model     IOU     Boundary  
  F-measure  
  256x144     93.58%     0.9024  
  160x96     90.79%     0.8542  
Evaluation of model accuracy, measured by IOU and boundary F-score.

We also release the accompanying Model Card for our segmentation models, which details our fairness evaluations. Our evaluation data contains images from 17 geographical subregions of the globe, with annotations for skin tone and gender. Our analysis shows that the model is consistent in its performance across the various regions, skin-tones, and genders, with only small deviations in IOU metrics.

Conclusion
We introduced a new in-browser ML solution for blurring and replacing your background in Google Meet. With this, ML models and OpenGL shaders can run efficiently on the web. The developed features achieve real-time performance with low power consumption, even on low-power devices.

Acknowledgments
Special thanks to the people who worked on this project, in particular Sebastian Jansson, Rikard Lundmark, Stephan Reiter, Fabian Bergmark, Ben Wagner, Stefan Holmer, Dan Gunnarson, Stéphane Hulaud and to all our team members who worked on the technology with us: Siargey Pisarchyk, Karthik Raveendran, Chris McClanahan, Marat Dukhan, Frank Barchard, Ming Guang Yong, Chuo-Ling Chang, Michael Hays, Camillo Lugaresi, Gregory Karpiak, Siarhei Kazakou, Matsvei Zhdanovich, and Matthias Grundmann.

How to foster productive and responsible debate | Ishan Bhabha

How to foster productive and responsible debate | Ishan Bhabha

The clash of ideas is fundamental to creativity and progress, but it can also be deeply destructive and create divisions within companies, communities and families. How do you foster productive debate while protecting against harmful speech and misinformation? Constitutional lawyer Ishan Bhabha lays out structures that organizations can use to navigate ideological disagreement and responsibly bring facts and context to a larger dialogue.

https://ift.tt/3ecGZGw

Click this link to view the TED Talk

Cloud infrastructure revenue grows 33% this quarter to almost $33B


The cloud infrastructure market kept growing at a brisk pace last quarter, as the pandemic continued to push more companies to the cloud with offices shut down in much of the world. This week the big three — Amazon, Microsoft and Google — all reported their numbers and as expected the news was good with Synergy Research reporting revenue growth of 33% year over year, up to almost $33 billion for the quarter.

Still, John Dinsdale, chief analyst at Synergy was a bit taken aback that the market continued to grow as much as it did. “While we were fully expecting continued strong growth in the market, the scale of the growth in Q3 was a little surprising,” he said in a statement.

He added, “Total revenues were up by $2.5 billion from the previous quarter causing the year-on-year growth rate to nudge upwards, which is unusual for such a large market. It is quite clear that COVID-19 has provided an added boost to a market that was already developing rapidly.”

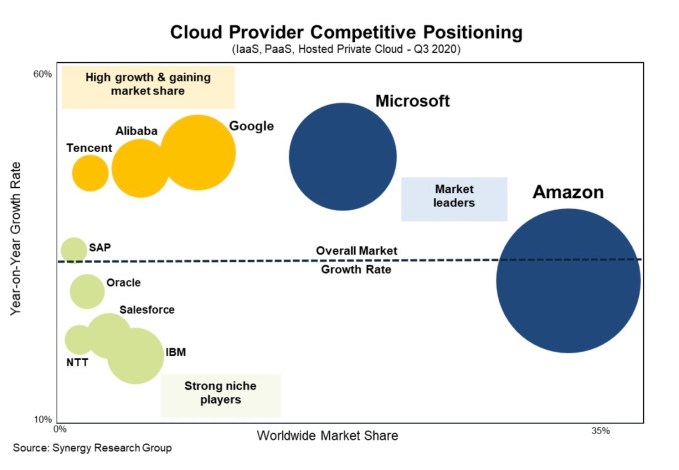
Per usual Amazon led the way with $11.6 billion in revenue, up from $10.8 billion last quarter. That’s up 29% year over year. Amazon continues to exhibit slowing growth in the cloud market, but because of its market share lead of 33%, a rate that has held fairly steady for some time, the growth is less important than the eye-popping revenue it continues to generate, almost double its closest rival Microsoft.

Speaking of Microsoft, Azure revenue was up 48% year over year, also slowing some, but good enough for a strong second place with 18% market share. Using Synergy’s total quarterly number of $33 billion, Microsoft came in at $5.9 billion in revenue for the quarter, up from $5.2 billion last quarter.

Finally Google announced cloud revenue of $3.4 billion, but that number includes all of its cloud revenue including G Suite and other software. Synergy reported that this was good for 9% or $2.98 billion, up from $2.7 billion last quarter, good for third place.

Alibaba and IBM were tied for fourth with 5% or around $1.65 billion each.

Synergy Research cloud infrastructure relative market positions. Amazon is the largest circle followed by Microsoft.

Image Credits: Synergy Research

It’s worth noting that Canalys had similar numbers to Synergy with growth of 33% to $36.5 billion. They had the same market order with slightly different numbers with Amazon at 32%, Microsoft at 19% and Google at 7% and Alibaba in 4th place at 6%.

Canalys sees continued growth ahead, especially as hybrid cloud begins to merge with newer technologies like 5G and edge computing. “All three [providers] are collaborating with mobile operators to deploy their cloud stacks at the edge in the operators’ data centers. These are part of holistic initiatives to profit from 5G services among business customers, as well as transform the mobile operators’ IT infrastructure,” Canalysis analyst Blake Murray said in a statement.

While the pure growth continues to move steadily downward over time, this is expected in a market that’s maturing like cloud infrastructure, but as companies continue to shift workloads more rapidly to the cloud during the pandemic, and find new use cases like 5G and edge computing, the market could continue to generate substantial revenue well into the future.


Read Full Article

Smartphone shipments dip in China for Q3, led by Huawei decline


China was the first major global smartphone markets to rebound from the early days of the COVID-19 pandemic. Stringent lockdown measures were able to help the country recover from the virus relatively quickly during the first wave, as sales started to return well ahead of other areas.

In Q3, however, things have taken begun to decline again. New numbers from Canalys point to an 8% drop between quarters — and a 15% drop, year-over-year. The firm chalks much of the slow down to longtime market leader Huawei’s on-going issues with the U.S. government. The problems had a kind of cascading effect that served to impact the number two companies, Vivo and Oppo.

Image Credits: Canalys

“Huawei was forced to restrict its smartphone shipments following the August 17 US sanctions which caused a void in channels in Q3 that its peers were not equipped to fill. Huawei is facing its most serious challenge since taking the lead in 2016,” analyst Mo Jia said in a release. “If the position of the US administration does not change, Huawei will attempt to pivot its business strategy, to focus on building the [Harmony] OS and software ecosystem, as the Chinese government is eager to nurture home-grown alternatives to global platforms.”

Huawei dropped 18% in Mainland China, year-over-year. Vivo and Oppo posted similar declines at 13 and 18%, respectively. Xiaomi was able to make up ground at third place, gaining 19% y-o-y per the figures. Apple, meanwhile, remained relatively stead, in spite of the delated launch of the iPhone 12. Huawei’s continued struggles could provide a vacuum for the competition to fill.

Analyst Nicole Peng notes that the arrival of the 5G handset put the U.S. company in a strong position, looking forward, “iPhone 12 series will be a game changer for Apple in Mainland China. As most smartphones in China are now 5G-capable, Apple is closing a critical gap, and pent-up demand for its new 5G-enabled family will be strong.”


Read Full Article

Things to Keep in Mind When Deciding on an Online Casino


Online casinos have to measure themselves against each other within an increasingly competitive market. Everyone who has browsed the web for a casino has noticed that there are abundantly many to choose between. Thus, it can be challenging to know which one to pick and what separates them from each other. Let’s take a quick […]

The post Things to Keep in Mind When Deciding on an Online Casino appeared first on ALL TECH BUZZ.


WhatsApp is now delivering roughly 100 billion messages a day


WhatsApp, the popular instant messaging app owned by Facebook, is now delivering roughly 100 billion messages a day, the company’s chief executive Mark Zuckerberg said at the quarterly earnings call Thursday.

For some perspective, users exchanged 100 billion messages on WhatsApp last New Year’s Eve. That is the day when WhatsApp tops its engagement figures, and as many of you may remember, also the time when the service customarily suffered glitches in the past years. (No outage on last New Year’s Eve!)

At this point, WhatsApp is just competing with itself. Facebook Messenger and WhatsApp together were used to exchange 60 billion messages a day as of early 2016. Apple chief executive Tim Cook said in May that iMessage and FaceTime were seeing record usage, but did not share specific figures. The last time Apple did share the figure, it was far behind WhatsApp’s then usage (podcast). WeChat, which has also amassed over 1 billion users, is behind in daily volume of messages, too.

In early 2014, WhatsApp was being used to exchange about 50 billion texts a day, its then chief executive Jan Koum revealed at an event.

At the time, WhatsApp had fewer than 500 million users. WhatsApp now has more than 2 billion users and at least in India, its largest market by users, its popularity surpasses those of every other smartphone app including the big blue app.

“This year we’ve all relied on messaging more than ever to keep up with our loved ones and get business done,” tweeted Will Cathcart, head of WhatsApp.

Sadly, that’s all the update the company shared on WhatsApp today. Mystery continues for when WhatsApp expects to resume its payments service in Brazil, and when it plans to launch its payments in India, where it began testing the service in 2018. (It has already shared big plans around financial services in India, though.)

“We are proud that WhatsApp is able to deliver roughly 100B messages every day and we’re excited about the road ahead,” said Cathcart.


Read Full Article

Ad revenues and e-commerce boom boost Facebook earnings but US users down from COVID surge


Facebook reported its Q3 earnings today, including revenues of $21.5 billion, and net income of $7.8 billion. The company earned $2.71 in per-share profit during the three-month period.

Analysts had expected Facebook, the social giant, to earn a much-smaller $1.91 per-share off smaller revenues of $19.82 billion. The company also reported an average of 1.82 billion daily active users in September, up 12% compared to the year-ago period. Monthly actives were 2.74 billion, also up 12%. Both results were ahead of expectations.

Notably Facebook’s headcount rose sharply during the year, rising 32% compared to the year-ago period. That outstripped its 22% year-over-year revenue growth. The company’s total expenses rose 28%, again faster than its revenues.

Shares of Facebook are effectively flat in after-hours trading, up around 0.4% at the time of writing.

The company did not share a specific outlook for Q4 2020 or 2021 in its report, instead noting that it anticipates “fourth quarter 2020 year-over-year ad revenue growth rate to be higher than [its] reported third quarter 2020 rate,” along with stronger non-advertising revenues stemming from Oculus Quest 2 sales, the company’s new VR helmet.

Facebook did say that 2021 will bring a “significant amount of uncertainty.” A potential hurdle of Facebook will be the regulatory environment in Europe, and viability of transatlantic data transfers. Facebook says that its “closely monitoring the potential impact on our European operations as these developments’ progress.”

Analysts expect Facebook to generate revenues of $24.25 billion and per-share profit of $2.67 in the fourth quarter of 2020, and $100.0 billion in 2021 top line leading to $10.26 in per-share income.

What matters in all of this? That the core advertising market that seemed to bolster Snap’s own results has helped fill Facebook’s wings as well. Facebook noted in its earnings that it thinks that the “pandemic has contributed to an acceleration in the shift of commerce from offline to online,” leading to it experiencing “increasing demand for advertising as a result of this acceleration.” Twitter, meanwhile, saw ad revenue only marginally increase, about 8% from the year prior, as advertiser taste buds remain volatile.

That’s a tailwind from a secular shift. For Facebook, it could mean a good year’s growth.

It’s worth noting, however, that Facebook lost users in the U.S. and Canada — down to 196 million from 198 million last quarter — a decline that it attributed to a slowing surge from the abnormal highs seen in the midst of the lockdowns associated with the COVID-19 pandemic. So tailwinds, but also a return to normal patterns. And it expects this flat or down trend to continue into Q3, noting that “in the fourth quarter of 2020, we expect this trend to continue and that the number of DAUs and MAUs in the US & Canada will be flat or slightly down compared to the third quarter of 2020.”


Read Full Article

Daily Crunch: Google had a good quarter


Google releases its latest earnings report, Spotify is getting ready to raise prices and Excel gets friendlier to custom data types. This is your Daily Crunch for October 29, 2020.

The big story: Google had a good quarter

Google’s parent company Alphabet released its third-quarter earnings report this afternoon, coming in well ahead of Wall Street expectations thanks in large part to YouTube, which saw revenue rise to $5.0 billion (compared to $3.8 billion during Q3 2019).

Google Cloud also grew revenue from $2.4 billion last year to $3.44 billion in the most recent quarter. Overall, Alphabet reported revenue of $46.2 billion and earnings per share of $16.40, compared to analyst predictions of $42.88 billion in revenue and EPS of $11.21.

The company’s shares quickly rose 8.5% in after-hours trading.

The tech giants

Spotify CEO says company will ‘further expand price increases’ — Although the company didn’t detail its plans, CEO Daniel Ek said the hikes will take place in markets that are more mature for Spotify.

Microsoft now lets you bring your own data types to Excel — That means you can have a “customer” data type, for example, bringing in rich customer data from a third-party service into Excel.

Why Apple’s Q4 earnings look different this year — With Apple’s latest iPhone launch running a few weeks behind this year, it missed the window to be included on Q4.

Startups, funding and venture capital

Donut launches Watercooler, an easy way to socialize online with co-workers — The startup also announced that it has raised $12 million in total funding, led by Accel.

One-click housing startup Atmos raises another $4M from Khosla, real estate strategics and TikTok star Josh Richards — According to CEO Nick Donahue, users have started designing the “first dozen homes” on the platform.

Commissary Club wants to help formerly incarcerated people find community —  While 70 Million Jobs focuses on helping people with criminal records find jobs, its new network Commissary Club is designed to be a place for folks to find community.

Advice and analysis from Extra Crunch

VCs poured capital into European startups in Q3, but early-stage dealmaking appeared to suffer — The VC trends of later and larger continue to change the landscape of private capital.

In the ‘buy now, pay later’ wars, PayPal is primed for dominance — Button’s Stephen Milbank writes that the greatest limitation to buy-now-pay-later adoption is its availability.

Twitter’s API access changes are chasing away third-party developers — On August 12, Twitter launched a complete rebuild of its 2012 API.

(Reminder: Extra Crunch is our membership program, which aims to democratize information about startups. You can sign up here.)

Everything else

Europe to limit how big tech can push its own services and use third-party data — Commission EVP Margrethe Vestager confirmed that a legislative proposal due in a few weeks will aim to ban what she called “unfair self-preferencing.”

Comcast says Peacock has nearly 22M sign-ups — But it’s not clear how many of them are paid versus free.

Tech optimism…in this economy? — The latest episode of Equity looks at big startup opportunities for the coming decade.

The Daily Crunch is TechCrunch’s roundup of our biggest and most important stories. If you’d like to get this delivered to your inbox every day at around 3pm Pacific, you can subscribe here.


Read Full Article

Twitter revenue rises 14%, but user growth fails to impress


Twitter continued to see its total traffic rise in the third quarter, thanks to that trifecta of returning sports, the presidential campaign and the COVID-19 pandemic. But there wasn’t nearly enough growth to appease Wall Street. 

Twitter beat out analyst expectations on revenue and net income; However, Wall Street was stuck on Twitter’s user user figures, which showed minimal growth and sent shares lower in after-market trading. Twitter’s MDAUs — the company’s internal audience metric that measures monetizeable daily active users — hit 187 million in the third quarter. That’s a razor thin improvement from the 186 million the company reported in second quarter of this year, although it did represent a 29% rise from the 145 million in the same period last year. Analysts from FactSet had expected 195 million MDAUs.

That mDAU “growth” heads into flat-like-the prairie states territory when focused on the U.S. figures. The average US mDAU was 36 million for the third quarter, the same figure in the second quarter. In short, U.S. mDAUs are flat, flat, flat. It did grow from 30 million mDAUs in the third quarter of 2019. Meanwhile, average international mDAU was 152 million for the third quarter, compared to 115 million in the same period of the previous year and 150 million in the previous quarter.

Shares were down nearly 15% in after-market trading.

Twitter reported Thursday net income of $29 million in the third quarter, or 4 cents per diluted share, a decline from the same time period last year, when the company brought in a net income of $47 million at 5 cents per diluted share. Adjusted earnings were 19 cents a share.

The company’s revenue came in at $936 million, up 14% from the same period last year and 37% from the second quarter. Analysts had expected revenue of $777 million. 

Twitter’s ad revenue also grew 15% to $808 million. Total ad engagement rose 27% over the same period in 2019. The return of live events as well as increased and previously delayed product launches helped boost ad revenue, Twitter CFO Ned Segal said.

“We also made progress on our brand and direct response products, with updated ad formats, improved measurement, and better prediction. We remain confident that our larger audience, coupled with ongoing revenue product improvements, new events and product launches, and the positive advertiser response to the choices we’ve made as we have grown the service, can drive great outcomes over time,” he added.

The U.S., Twitter’s biggest market, accounted for $513 million in revenue, a 10% increase YoY. 

However, Twitter warned that the holiday season and U.S. election could impact advertiser behavior.


Read Full Article

Strong YouTube ad growth powers Alphabet to better-than-expected Q3


Today after the bell, Alphabet announced its Q3 performance. The Google parent company generated revenues of $46.2 billion and per-share profit of $16.40 off the back of net income of $11.2 billion.

Analysts had expected Alphabet to earn $11.21 per share, from revenues of $42.88 billion according to Yahoo Finance; other estimates were larger, targeting $11.37 in per-share income off revenue of $42.84 billion.

The company’s shares instantly rose around 8.5% after its earnings beat.

Digging into the company’s numbers, YouTube revenue rose to $5.0 billion, from $3.8 billion in Q3 2019. Analysts had expected YouTube to generate $4.52 billion in total revenue during the most recent quarter.

Google Cloud managed to generate $3.44 billion from $2.4 billion in Q3 2019. The Google Cloud collection of cloud computing, productivity software, and other enterprise services generated $3.0 billion in the second quarter of this year. Analysts had expected Google Cloud to generate $3.31 billion in total revenue during the most recent quarter.

And Alphabet’s skunkworks division, Other Bets managed to generate $178 million in revenue, another quarter in which the set of companies was an excellent source of negative operating income. The collection of efforts lost $1.1 billion in the quarter.


Read Full Article

Google tests a helpful app comparison feature on Google Play


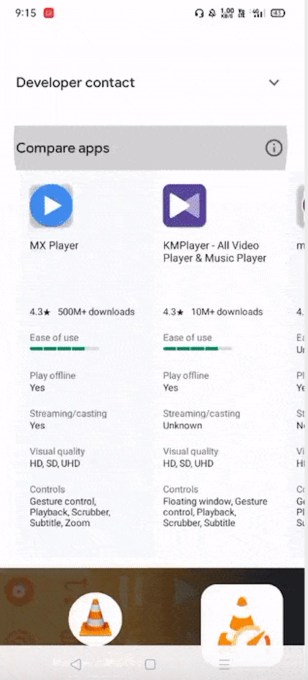
Google is testing a new feature that could improve discovery for Android apps on Google Play. The company confirmed it’s experimenting with a “Compare Apps” option that would allow Google Play users to quickly and more easily understand the slight differences between otherwise similar apps by comparing specific features and metrics — like star ratings or total downloads, for example.

The feature was first spotted by Android Police, which found it at the bottom of an individual app listing page for a media player on the Play Store (ver. 22.4.28).

Image Credits: Android Police

Google confirmed the feature is live but only as a small test.

After users scrolled down past the app details and reviews, the page offered a comparison chart that allowed users to compare the VLC Player app with other media players across aspects like “Ease of Use,” support for offline play, and various media player specific features — like visual quality (HD, SD, etc.) and controls (gesture control, playback, scrubber, etc.).

The feature may leverage data Google has sourced from questions it asked app reviewers, though that aspect is not clear at this time. It also pulls in other data it already has on file, like the aggregate star rating and how many downloads the app has seen to date, for instance.

Typically, in place of the comparison chart, Google Play would provide a list of “similar apps” at the bottom of the listings page. This is similar to Apple’s “You Might Also Like” app suggestions and common across app stores. The idea with “similar apps” is to help point users researching apps to others in same genre. But making a determination of which to download often requires reading through the app’s descriptions and user reviews, which can be time-consuming.

With a comparison chart, users could more quickly figure out which app was the better fit for their needs, instead of wasting time researching or downloading multiple apps to install only to find they didn’t offer a particular feature the user had wanted.

Google confirmed to TechCrunch this is a “small experiment” that’s currently running, but says it doesn’t have immediate plans for a broader rollout. That’s a shame!


Read Full Article

Google brings Halloween to life using augmented reality


There’s an AR ghost on Google Search. There’s a dancing skeleton, set of creepy jack-o’-lanterns, and costumed cats and dogs, too. Ahead of Halloween weekend in the U.S., Google has launched a set of fun, augmented reality-powered features on Google Search which appear as an option when you search for specific Halloween terms using a mobile device.

For example, if you search for the word “Halloween” and scroll down the search results page, you’ll see a box that prompts you to “Summon up a 3D ghost.” When you tap the “View in 3D” button, you’re able to see the ghost floating around your room.

On the iPhone, you’ll first have to move the phone around the room to get started, as with other AR apps. On Android devices, however, the ghost immediately appears in 3D but there’s a separate button, “View in your space,” that will place the ghost in the environment with you.

Google says the features work in the Google Search app and in the mobile browser.

Once the AR object has been placed in your room, you can move around it to view it from different angles, move closer or further away, or drag it around it around with your finger. The object even leaves a shadow on the floor, to make it seem like it’s really there.

Spooky, Halloween music will also play in the background as the AR objects float or dance in your space. You can then take a photo or a video to share elsewhere, if you choose.

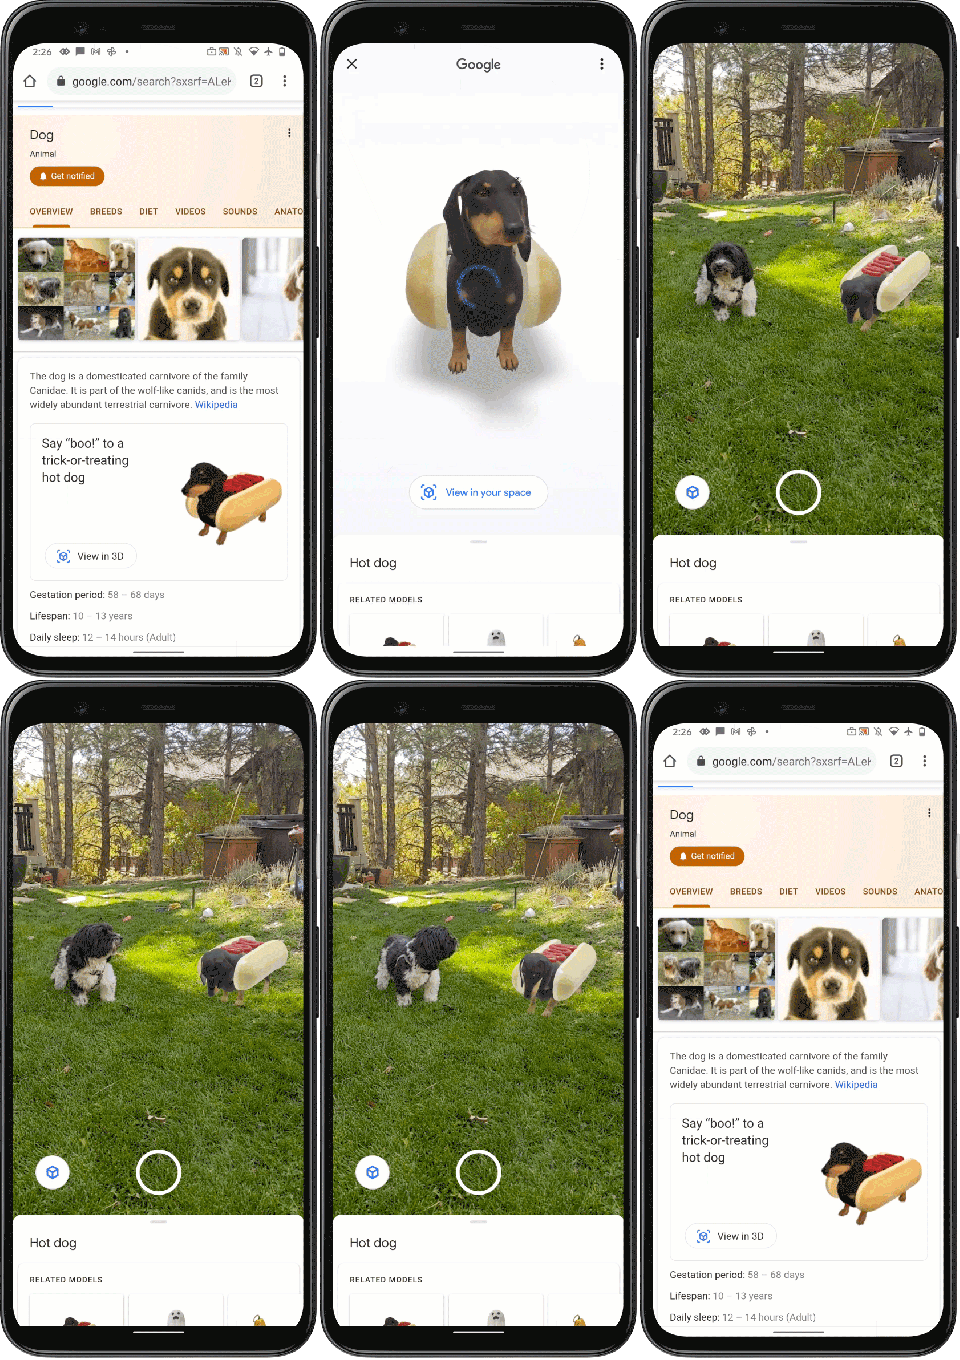
In addition the AR ghost, you can search for a set of three jack-o’lanterns, a dancing skeleton, a hot dog (well, a dog in a hot dog costume), a pirate dog, and a magic cat.

The latter two appear when you google for the keywords “dog” or “cat,” while a search for “hot dog” will pull up the playful dachshund that paws at the ground and wags its tail. Searches for “skeleton” and “jack-o’-lantern” (and some variations) will bring up the others.

You may also see a pop-up at the bottom of the main Google.com landing page that suggests you try the new AR feature, but it wasn’t showing up consistently for us on every visit.

Google has experimented with AR features on Google Search for some time, having offered up 3D models of animals, places, spaceships, celestial bodies including the moon, the planets and more, as well as biology terms, anatomical systems, chemistry terms, plus cars, shoes, and even Santa.

Unfortunately, there’s no easy way to find all the AR objects offered in one place — you usually just stumble upon them when searching.

Besides the AR Halloween search feature, Google also introduced two new doorbell ringtones for its Hello Nest devices, “Black Cat” and “Werewolf.” You can continue to use the sounds introduced last year, like ghost, vampire, monster or witch noises, for example.

Google Assistant, meanwhile, now tells Halloween-themed riddles and can sing a Halloween song, as well, in another nod to the holiday.


Read Full Article

Experimenting with Automatic Video Creation From a Web Page


At Google, we're actively exploring how people can use creativity tools powered by machine learning and computational methods when producing multimedia content, from creating music and reframing videos, to drawing and more. One creative process in particular, video production, can especially benefit from such tools, as it requires a series of decisions about what content is best suited to a target audience, how to position the available assets within the field of view, and what temporal arrangement will yield the most compelling narrative. But what if one could leverage existing assets, such as a website, to get a jump-start on video creation? Businesses commonly host websites that contain rich visual representations about their services or products, all of which could be repurposed for other multimedia formats, such as videos, potentially enabling those without extensive resources the ability to reach a broader audience.

In “Automatic Video Creation From a Web Page”, published at UIST 2020, we introduce URL2Video, a research prototype pipeline to automatically convert a web page into a short video, given temporal and visual constraints provided by the content owner. URL2Video extracts assets (text, images, or videos) and their design styles (including fonts, colors, graphical layouts, and hierarchy) from HTML sources and organizes the visual assets into a sequence of shots, while maintaining a look-and-feel similar to the source page. Given a user-specified aspect ratio and duration, it then renders the repurposed materials into a video that is ideal for product and service advertising.

URL2Video Overview
Assume a user provides an URL to a web page that illustrates their business. The URL2Video pipeline automatically selects key content from the page and decides the temporal and visual presentation of each asset, based on a set of heuristics derived from an interview study with designers who were familiar with web design and video ad creation. These designer-informed heuristics capture common video editing styles, including content hierarchy, constraining the amount of information in a shot and its time duration, providing consistent color and style for branding, and more. Using this information, the URL2Video pipeline parses a web page, analyzing the content and selecting visually salient text or images while preserving their design styles, which it organizes according to the video specifications provided by the user.

By extracting the structural content and design from the input web page, URL2Video makes automatic editing decisions to present key messages in a video. It considers the temporal (e.g., the duration in seconds) and spatial (e.g., the aspect ratio) constraints of the output video defined by users.

Webpage Analysis
Given a webpage URL, URL2Video extracts document object model (DOM) information and multimedia materials. For the purposes of our research prototype, we limited the domain to static web pages that contain salient assets and headings preserved in an HTML hierarchy that follows recent web design principles, which encourage the use of prominent elements, distinct sections, and an order of visual focus that guides readers in perceiving information. URL2Video identifies such visually-distinguishable elements as a candidate list of asset groups, each of which may contain a heading, a product image, detailed descriptions, and call-to-action buttons, and captures both the raw assets (text and multimedia files) and detailed design specifications (HTML tags, CSS styles, and rendered locations) for each element. It then ranks the asset groups by assigning each a priority score based on their visual appearance and annotations, including their HTML tags, rendered sizes, and ordering shown on the page. In this way, an asset group that occupies a larger area at the top of the page receives a higher score.

Constraints-Based Asset Selection
We consider two goals when composing a video: (1) each video shot should provide concise information, and (2) the visual design should be consistent with the source page. Based on these goals and the video constraints provided by the user, including the intended video duration (in seconds) and aspect ratio (commonly 16:9, 4:3, 1:1, etc.), URL2Video automatically selects and orders the asset groups to optimize the total priority score. To make the content concise, it presents only dominant elements from a page, such as a headline and a few multimedia assets. It constrains the duration of each visual element for viewers to perceive the content. In this way, a short video highlights the most salient information from the top of the page, and a longer video contains more campaigns or products.

Scene Composition & Video Rendering
Given an ordered list of assets based on the DOM hierarchy, URL2Video follows the design heuristics obtained from interview studies to make decisions about both the temporal and spatial arrangement to present the assets in individual shots. It transfers the graphical layout of elements into the video’s aspect ratio, and applies the style choices including fonts and colors. To make a video more dynamic and engaging, it adjusts the presentation timing of assets. Finally, it renders the content into a video in the MPEG-4 container format.

User Control
The interface to the research prototype allows the user to review the design attributes in each video shot extracted from the source page, reorder the materials, change the detailed design, such as colors and fonts, and adjust the constraints to generate a new video.

In URL2Video's authoring interface (left), users specify the input URL to a source page, size of the target page view, and the output video parameters. URL2Video analyzes the web page and extracts major visual components. It composes a series of scenes and visualizes the key frames as a storyboard. These components are rendered into an output video that satisfies the input temporal and spatial constraints. Users can playback the video, examine the design attributes (bottom-right), and make adjustments to generate video variation, such as reordering the scenes (top-right).

URL2Video Use Cases
We demonstrate the performance of the end-to-end URL2Video pipeline on a variety of existing web pages. Below we highlight an example result where URL2Video converts a page that embeds multiple short video clips into a 12-second output video. Note how the pipeline makes automatic editing decisions on font and color choices, timing, and content ordering in a video captured from the source page.

URL2Video identifies key content from our Google Search introduction page (top), including headings and video assets. It converts them into a video by considering the presentation flow, the source design and the output constraints (a 12-second landscape video; bottom).

The video below provides further demonstration:

To evaluate the automatically-generated videos, we conducted a user study with designers at Google. Our results show that URL2Video effectively extracted design elements from a web page and supported designers by bootstrapping the video creation process.

Next steps
While this current research focuses on the visual presentation, we are developing new techniques that support the audio track and a voiceover in video editing. All in all, we envision a future where creators focus on making high-level decisions and an ML model interactively suggests detailed temporal and graphical edits for a final video creation on multiple platforms.

Acknowledgments
We greatly thank our paper co-authors, Zheng Sun (Research) and Katrina Panovich (YouTube). We would also like to thank our colleagues who contributed to URL2Video, (in alphabetical order of last name) Jordan Canedy, Brian Curless, Nathan Frey, Madison Le, Alireza Mahdian, Justin Parra, Emily Ryan, Mogan Shieh, Sandor Szego, and Weilong Yang. We are grateful to receive the support from our leadership, Tomas Izo, Rahul Sukthankar, and Jay Yagnik.


Juganu begins selling its tunable lighting system for pathogen disinfection and deactivation in the US


Juganu, the venture-backed Israeli company that makes lighting systems capable of emitting light at specified wavelengths, is now selling a product that it claims can disinfect surfaces and deactivate pathogens in an attempt to provide buildings with new safety technologies that can prevent the spread of the coronavirus that causes COVID-19.

The company claims that its J.Protect product was clinically validated through a study conducted by Dr. Meital Gal-Tanamy at the Bar-Ilan University Faculty of Medicine (although Dr. Gal-Tanamy’s research typically focuses on the Hepatitis C virus, which has a different transmission vector than airborne viruses like Sars-Cov-2, the coronavirus that causes COVID-19).

Juganu said that the new product has been registered with the U.S. Environmental Protection Agency in 48 states and is currently working with Comcast, Qualcomm and NCR Corp. to bring its lighting disinfectant and deactivation technology to markets around the country.

The lighting technology uses two kinds of ultraviolet light — A and C — to render viruses inert and kill bacteria on surfaces, according to the company’s claims.

When people are present in a room, the company’s system uses UVA light which can render viruses inert after eight hours of exposure. If the room is empty, the lighting system will use UVC light, which is more potent as a disinfectant and more harmful to people, to disinfect a room in less than an hour.

The company tested its technology on surfaces, but did not conduct any tests involving their lighting system’s effects on aerosolized viral particles, which have been determined to be the main cause of infections from the novel coronavirus.

“We got an exemption from the FDA and are approved for distribution by the EPA in 48 states,” said Juganu chief executive, Eran Ben-Shmuel in an interview.

The company has already pre-sold the lighting technology in Israel and in India, according to Ben-Shmuel, and is now taking orders for installations in the U.S.

Juganu, which has raised $53 million to date from investors, including Comcast Ventures, Viola Growth, Amdocs and OurCrowd, has offices in Israel, Brazil, Mexico and the U.S., and has sold lighting systems to municipalities and businesses around the world.

The new hardware opens up a new line of business in the booming market for technologies targeting the reopening of businesses in the nations that have been hit hardest by the COVID-19 pandemic.

“Smart lighting will be one of the biggest areas of opportunity for physical spaces. We are evolving from lights simply illuminating spaces to disinfecting and securing them, as well as promoting well-being by recreating natural light shifts based on sunrise and sunset,” said Ben-Shmuel, in a statement. 


Read Full Article