
In September of 2018, Google launched a new dataset search engine intended to help researchers pour through large datasets from public sources. These include everything from census data, demographics surveys, medical studies, and much more.
The datasets are primarily for academic researchers to crunch numbers and extract patterns. But even for the regular layperson, some of the datasets are just fascinating to explore.
How Google Dataset Searches Work
For many years, one of the greatest weaknesses of Google’s search engine was that entire segments of an underground internet remained invisible.
This internet remained “underground” because the information itself is unsearchable by Google’s web crawler. This is because the data is stored in databases that require special search queries, or as a data file that you can only download and analyze.
However, when you use the Google Dataset search to find information, instead of returning websites, it returns a list of databases.
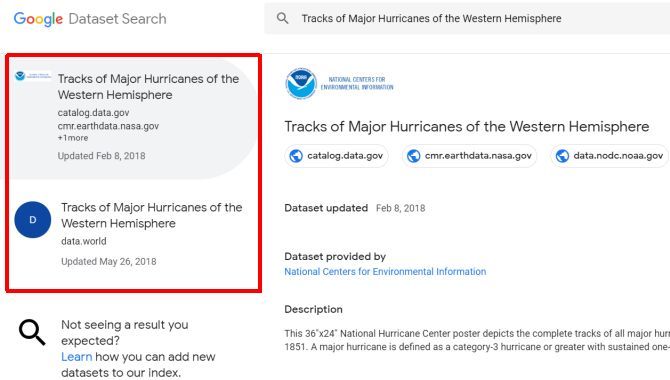
You can click on any of those databases to see links to the source data.
The source data could include a searchable database, a downloadable file, or even a online visualization tool that helps you analyze and visualize the large volume of information contained in the database.
What kind of information can you find?
Here are some of the most interesting datasets linked from Google’s dataset search engine for you to browse through.
1. National Oceanic and Atmospheric Administration
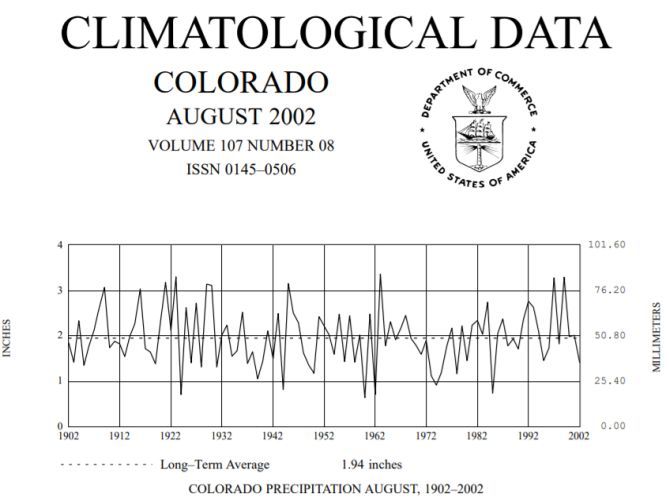
Through the Google Dataset, you’ll find links to the NOAA EV2 Image Access System.
This is an impressive archival of old climate data from microfiche to digital format, provided for free to the general public.
Some of the impressive records you can pull out of this database include:
- Airport weather station recordings of temperature, precipitation, and wind data going back decades
- Weather station readings of daily temperatures and precipitation amounts going back to the late 1800s in some cases
- Precipitation data recorded at the National Weather Service and Federal Aviation Administration going back many years
In each case, you’ll need to choose the state that you want data for. The number of years you can go back and pull data depends on the state.
For armchair climatologists, or anyone simply interested in global climate change, this is a remarkable resource.
2. NOAA Interactive Maps
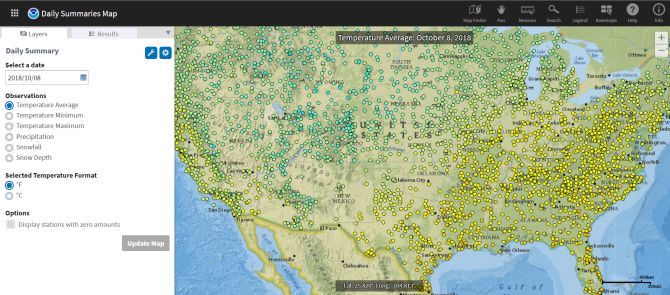
In addition to the downloadable datasets, on Google Datasets you’ll also come across links to the NOAA’s interactive maps.
These maps are unbelievable resources that let you tailor a view of climate data based on date and measurement.
NOAA interactive maps include a visual representation of each of the following data trends.
- Daily or monthly observations of all data
- Only snowfall levels
- Historical global marine shipping tracks
- Weather radar images from 1995 to 2010
- Climate normals (the average of climate variables over three decades) from 1981 to 2010
These maps are fascinating to explore, looking through the years and watching how the climate of the Earth slowly changed. Even for anyone who isn’t a climatologist, these interactive maps are an amazing resource.
3. NASA Storm Tracks
The NASA website has always been a warehouse of useful information. What many people may not realize is they also collect and share satellite data about weather patterns from around the world.
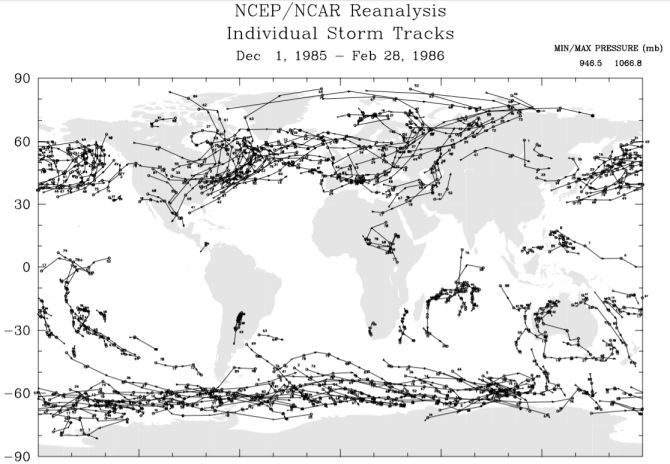
One of the most extensive datasets is NASA’s Atlas of Extratropical Storms. It covers storm data from 1961 to 1998. From the dataset page, you can choose month or season and year, and request a download for any of the following aspects of major storms that took place that year.
- Frequency
- Intensity
- Frequency, Polar Projection
- Intensity, Polar Projection
- Tracks
It’s impressive to review storm patterns going back for several decades. It’s an invaluable library of data for any researchers looking for climate patterns.
4. WHISPers
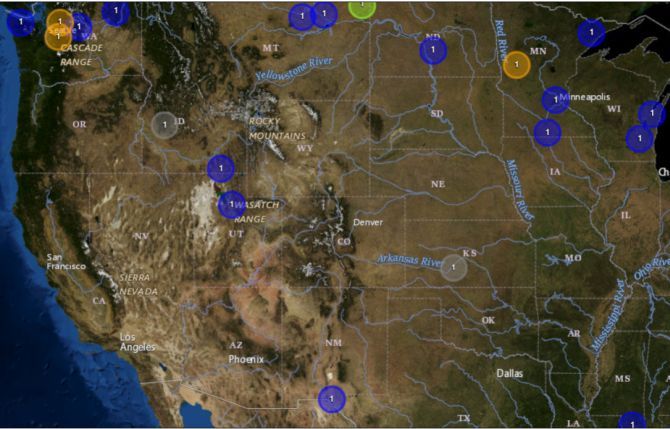
WHISPers is the Wildlife Health Information Sharing Partnership event reporting system. It’s an interactive map that shows you the 20 most recent wildlife health events that have taken place in the United States.
You might occasionally hear of mass bird deaths, illnesses killing off populations of bats, or cases of a chronic wasting disease in the news. But if you were to monitor this map, you’d see clusters of such cases showing up long before they ever show up in the media.
5. Human Ebola Outbreak
The spread of human disease is a fascinating field to follow. There is no human illness outbreak in modern times quite as terrifying as Ebola outbreaks. West Africa made the news in 2014 when the region saw one of the worse Ebola outbreaks in human history.
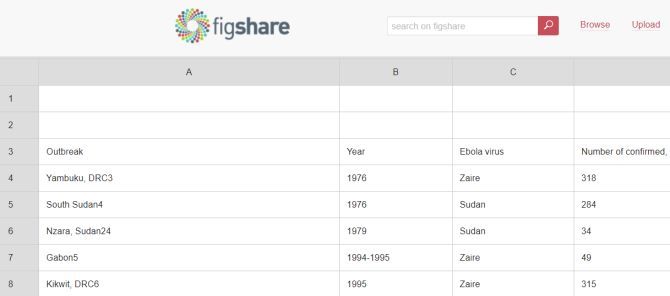
However, there have been other Ebola outbreaks in the past. Those are logged and shared at this online database provided by Figshare.
The dataset starts at 1976 and continues to the present. It’s interesting to follow the ebb and flow of outbreaks, how long there appear to be no outbreaks, and then how aggressively they seem to start again.
You can download the detailed dataset under the online web version of the general data.
6. Global Population Estimates and Projections
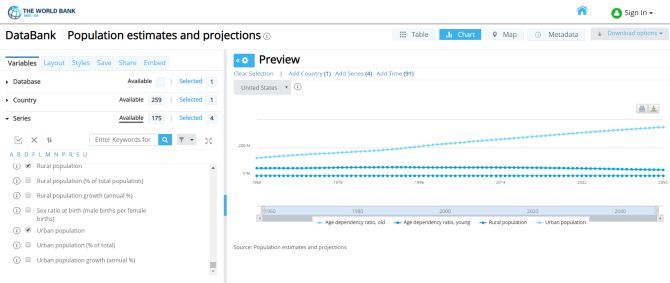
If you search the Google Dataset for “global population estimates”, you’ll come across a link for the World Bank’s interactive “population estimates and projections” tool.
This is an impressive tool that lets you choose from what country and series of data to plot. On the right you can see the data results in the form of a table, chart, or map.
Reviewing the trend of population projections across factors like demographics and country is very revealing. The tool saves you a great deal of time. Instead of digging through the metadata yourself and developing these charts, the World Bank tool does it all for you.
Even more impressive is that you’re not limited to the population database. You can switch the main database from population to poverty, universal health coverage, jobs, educational statistics, and many others.
Of any dataset link provided by Google, this is one of the most useful.
7. National UFO Reporting Center
The more you dig into Google Datasets, the more it’ll surprise you just what kind of information you can uncover.
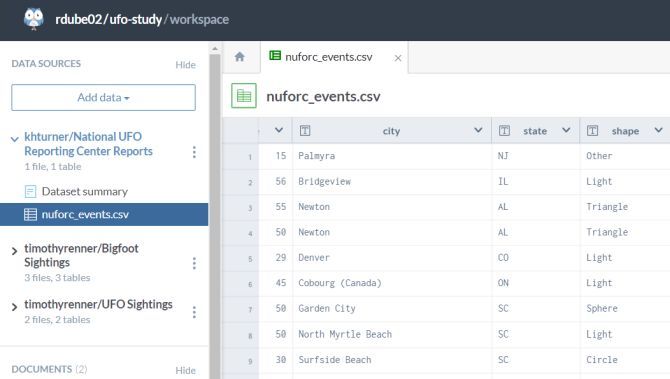
For example, there’s a link to download all of last year’s UFO reports from the National UFO Reporting Center. The data includes the location of the incident, what kind of object was spotted, how long the sighting lasted, the witness’s summary, and more.
Think you can spot patterns based on time and location of clustered sightings? Give it a shot by downloading the entire dataset and looking for correlations.
Searching Google Datasets
The volume of information you’ll find using the Google Datasets search is impressive. The examples above are only just the tip of the iceberg. Try typing in a few keywords of your own and see what you can discover yourself.
And if you aren’t sure how to analyze the large volumes of data you find, load them into Excel. Excel is a powerful tool for analyzing large sets of data. If you’ve never done this before, you can learn more about Excel’s data analysis capabilities before you start digging through all of the information you’ll uncover.
Read the full article: 7 Amazing Google Dataset Search Results You Can Use Now
Read Full Article
No comments:
Post a Comment