Mobile adoption around the world is having a significant impact on the web’s traffic. According to a new report from SimilarWeb, out today, mobile web traffic has jumped 30.6% since 2017, while desktop traffic dropped 3.3%. But it’s not just the numbers that are changing. Mobile visitors also behave differently from their desktop web counterparts, staying on pages for shorter periods of time, for example, which is impacting core metrics web publishers today track.
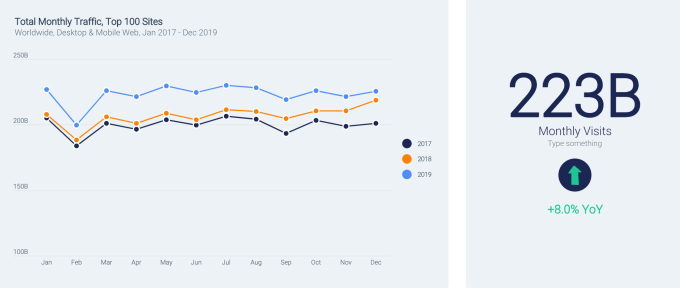
The report found that 2019’s total web traffic to the top 100 sites was up 8% from 2018, and up 11.8% over 2017, averaging 223 billion visits per month. The largest increases were in April and June 2019, when traffic was up by more than 10% over the same time in 2018.
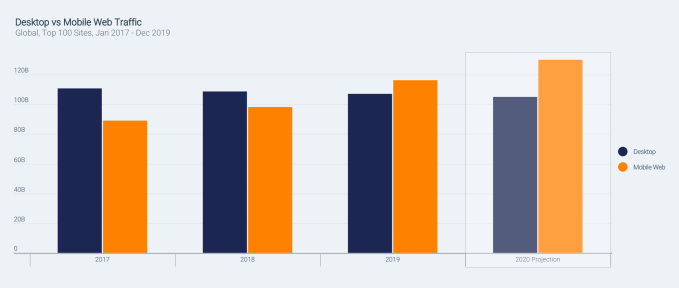
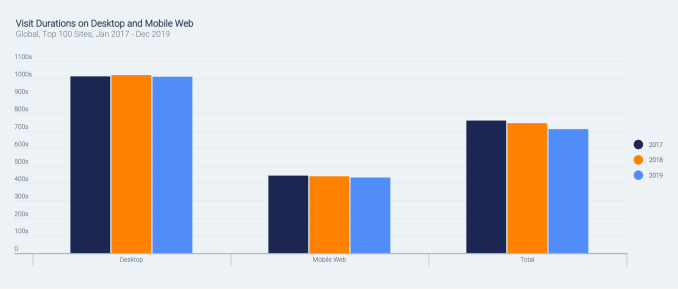
Mobile is driving these traffic increases, but mobile visitors don’t stay as long on the site. Across platforms, the overall time spent on websites has dropped by 49 seconds from 2017 to 2019, the report found.
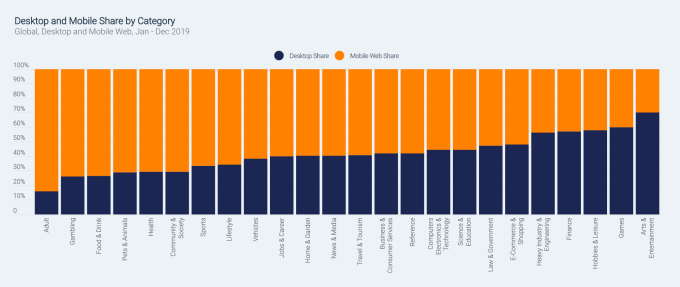
In addition, mobile has become the platform of choice for visiting certain categories of websites. Mobile traffic dwarfs desktop on adult sites, gambling sites, food & drink, pets & animals, health, community & society, sports, and lifestyle. And over the years, other categories shifted to become more mobile as well — including news and media, vehicle sites, travel, reference, finance, and others.
But not all categories are doing well, despite the shift to mobile.
News sites, for instance, were losing traffic. The report found that traffic to the top 100 media publications is down 5.3% year-over-year from 2018 to 2019 (a loss of 4B visits), and down by 7% since 2017.
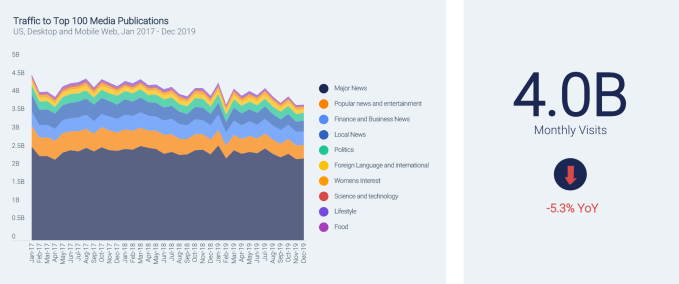
These decreases impact all sorts of media categories, with popular news, entertainment news, and local news all showing decreases of over 25%. Only business & finance and women’s interest news categories saw any increases, the report said.
The increase in mobile traffic is also helping the biggest sites on the web grow larger, helping to further cement their position on today’s internet. The top 10 biggest sites saw a total of 167.5 billion monthly visits in 2019, up 10.7% over 2018. The remaining 90 biggest sites out of the top 100 only saw a 2.3% increase, by comparison.
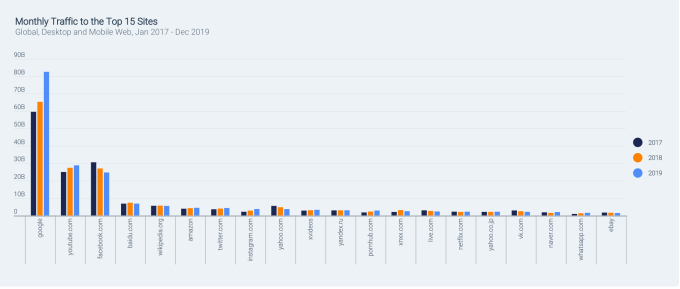
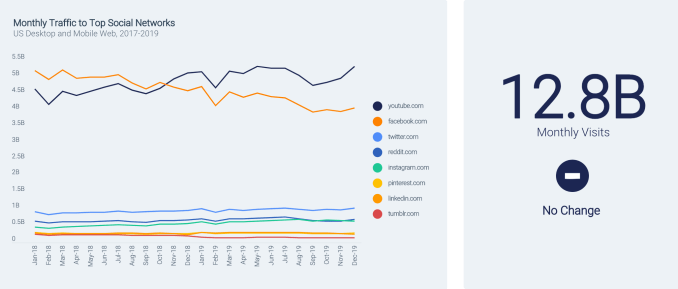
Google’s move to consolidate traffic to its core domain increased traffic to google.com helped to increase its numbers and YouTube grew as well. However, Facebook’s troubles were reflected in its numbers as it lost 8.6% of traffic over the past year alone. The report theorized that some of its lost traffic went to YouTube, which could inform Facebook’s heavier focus on video in recent years. That said, Facebook’s investments in mobile helped it grow elsewhere — both Instagram and WhatsApp saw their web traffic grow up to 74% year-over-year.
Also on the decline were Yahoo, which lost 33.6% of its 2017 traffic, and Tumblr, which banned adult sites in 2018, leading to a 33% loss in traffic.
Facebook fought off the web traffic declines and related declines in app usage by re-engaging existing users in 2019, which helped it to increase the total number of app sessions throughout the year. YouTube uses a similar tactic to increase its own app engagement figures, leading to a close tie between the two on this metric.
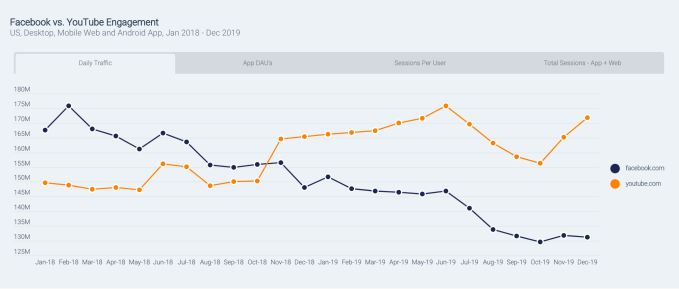
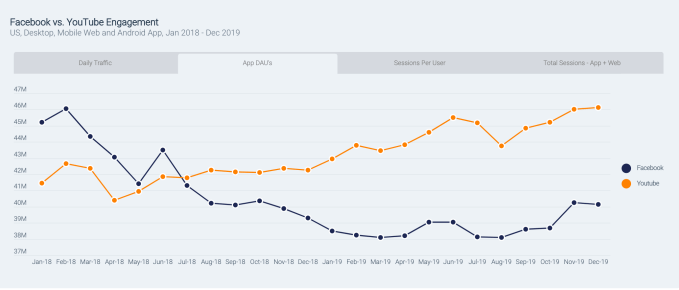
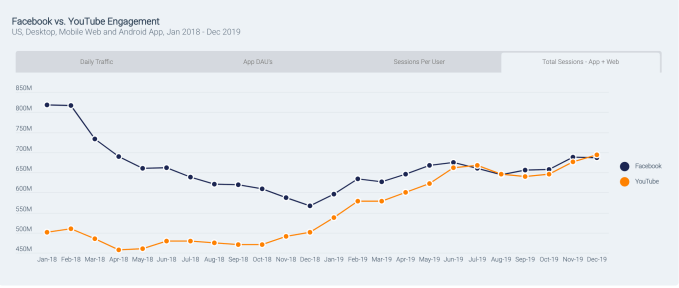
The data for the report was gathered from January 2017 to December 2019, and tracked desktop and mobile web traffic, as well as Android app use.
The full report, available here, also dug into specific categories, like shopping, travel, finance, messaging, and more.
Read Full Article
No comments:
Post a Comment