Adobe Illustrator is a popular design choice when creating infographics. If you need to incorporate a table into your designs, there’s a handy setting that makes creating tables pretty simple.
To create a table in Adobe Illustrator, open a new document and do the following:
- Click on the Rectangle tool or use the keyboard shortcut M.
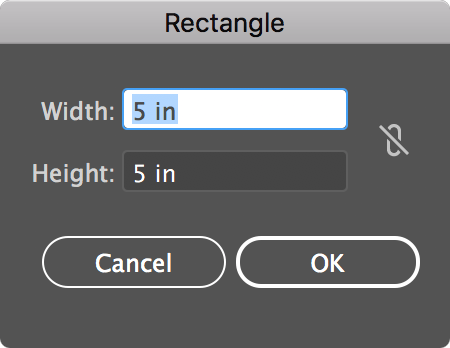
- If you know the exact dimensions for your table, click anywhere in the canvas and enter the width and height of your rectangle. You can also just freehand draw the rectangle if you prefer.

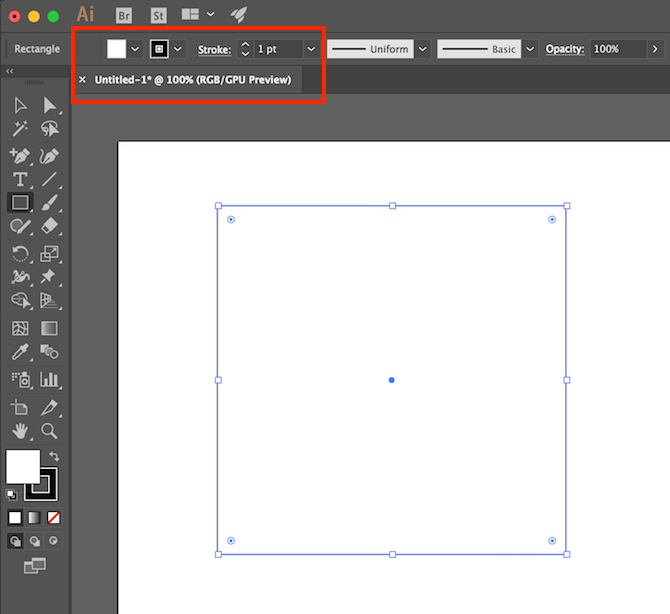
- With your rectangle selected, you can change the fill and stroke color with the top Illustrator menu.

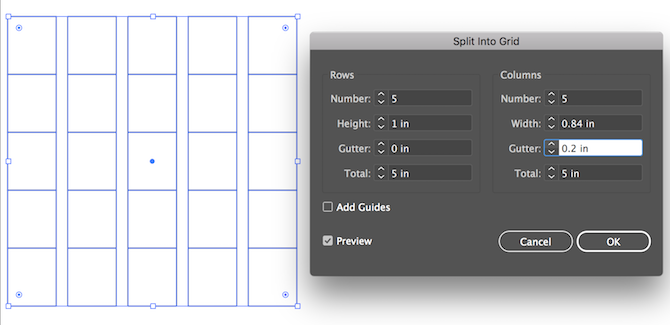
- Once you’ve made those selections, with the rectangle still selected, go to Object > Path > Split into Grid
- In the dialog box that opens, you can choose the following: the number of rows and row height; the number of columns and column width; the gutter between your rows and columns; and the total size of your table. If you want to see how your table will look before committing to your settings, make sure that Preview is checked.

- Once you’ve made your selections, click OK.
The resulting table will actually be a series of separate squares or rectangles depending on your dimensions. If you want to move or resize your table, be sure to select all the shapes using Ctrl/Cmd + A and grouping them together using the keyboard shortcut Ctrl/Cmd + G.
You can make changes to your table after the fact. Just select the entire table and go through the same steps above to change the number of rows and columns, or to change the fill and stroke of your cells.
You can also manually change the dimensions of the table by selecting all the sells and dragging the anchor points to make the entire table (or specific rows/columns) narrower or wider.
If you’re looking for another quick and easy method, create a table in Microsoft Word instead.
Read the full article: How to Create a Table in Adobe Illustrator
Read Full Article


No comments:
Post a Comment