Google Sites is one of the most convenient ways to create and publish a website with the least amount of effort. With the tools available in Google Sites, you can actually create very useful personal dashboards that can boost your organization and productivity.
In this article, you’re going to see how you can use Google Sites to create some very cool dashboards that can:
- Monitor your email
- Analyze your website performance
- Create a time management system
- Stay informed with live news
- Save your favorite locations
1. Email Monitoring Dashboard
One of the most annoying things about email is that you need some kind of email client to know when a new email has arrived in your inbox.
If you have a Google email account, that might be your preferred online Gmail inbox, or any of the desktop email clients out there.
But with Google Sites, you could actually build a custom data dashboard to display all incoming emails in one place. With a single dashboard, you can just glance to see all the new incoming emails for the day.
This requires syncing Gmail to a Google Sheets and then displaying those sheets in a Google Sites page.
Display Timestamp of Latest Email
It’s possible to sync Gmail with Google Sheets using IFTTT. But with IFTTT you can only do this with one Gmail account. This is why I usually turn to Zapier to sync multiple Gmail accounts to multiple Google Sheets. However, keep in mind that Zapier isn’t free.
With Zapier, you just create a “Zap” with an input for the Gmail account you want to monitor and choose it to trigger with every new incoming email. Then choose Google Sheets as the output.
You should create a Google Sheet called “Incoming Emails” ahead of time.
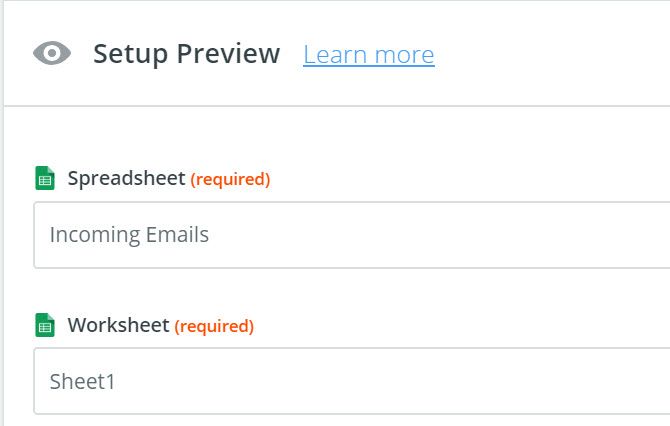
Zapier lets you choose the spreadsheet by name and the worksheet inside it where you want your email information to go.
In this first example, you’ll create a widget on your dashboard that shows each account.
Something like this:
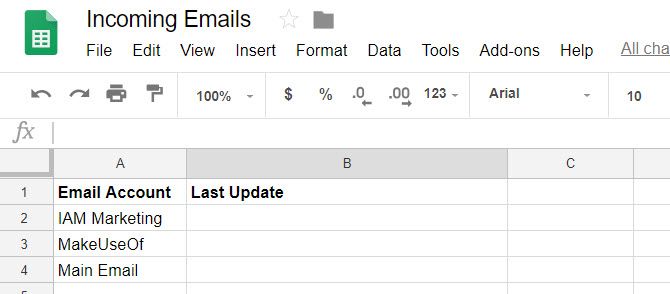
Every few minutes, the script will run and update the second column, of the row you specify.
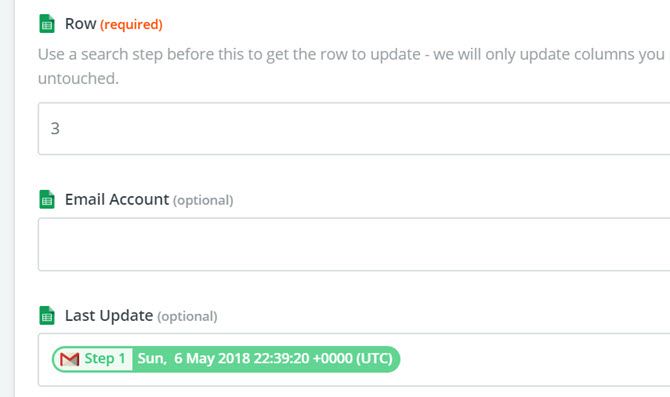
So to update the MakeUseOf row with the timestamp of the latest email in the inbox, I’d choose row three. Then select the email data you want to import.
In this case, I’m importing the received date of the latest email.
Once an individual “Zap” is created for each gmail account, the dashboard widget will look something like below.
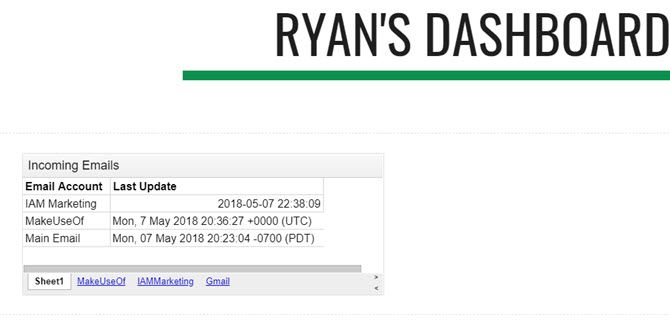
You can import this widget into your Google Sites web page (dashboard) by clicking on Sheets under the Insert menu on the right side of the page.
Display All Incoming Email
To add a widget that’ll show you all the incoming emails for the day, create the same kind of Zap. Also, create three columns in the sheet: Name, Date, and Subject.
Then, when you add the Sheet action in the Zap, you’ll choose the same workbook, but choose the sheet you created for that email account.
Then fill out the fields with the email data you want to import.
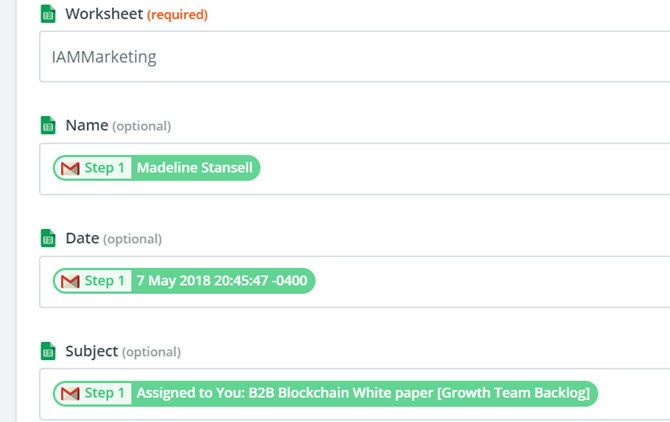
This will bring all new incoming emails into your new Google Sheet. Here’s what the widget will look like when you import it into your new dashboard.
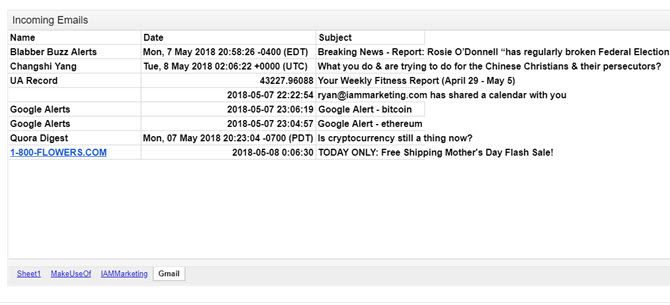
Of course, you don’t want to just let this sheet keep filling up. The widget’s purpose is to show you incoming emails for the day, so you’ll want to add a Google Script to the sheet to clear out the sheets every day at midnight.
This is very easy to do. In the Google sheet, just click on the Tools menu, and select Script editor.
Paste a new function called “ClearAll” into this script editor.
function ClearAll() {
var start, end;
var sheet = SpreadsheetApp.getActive().getSheetByName('Makeuseof');
start = 2;
end = sheet.getLastRow() - 1;//Number of last row with content
      //blank rows after last row with content will not be deleted
sheet.deleteRows(start, end);
var sheet = SpreadsheetApp.getActive().getSheetByName('IAMMarketing');
start = 2;
end = sheet.getLastRow() - 1;//Number of last row with content
      //blank rows after last row with content will not be deleted
sheet.deleteRows(start, end);
var sheet = SpreadsheetApp.getActive().getSheetByName('Gmail');
start = 2;
end = sheet.getLastRow() - 1;//Number of last row with content
      //blank rows after last row with content will not be deleted

sheet.deleteRows(start, end);
}
You’ll want to edit the “getSheetByName” section with the actual name of your sheets that contain the emails.
To run this script every day at midnight, in the Script Editor, save your script by clicking on File and then Save. Then click on Edit and Current project’s triggers.
Set the events to Time-driven, Day timer, and Midnight to 1am. Then click Save.
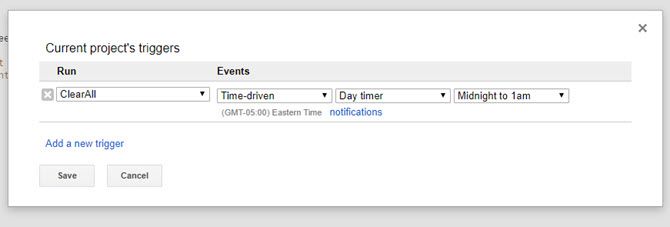
This will clear all sheets at midnight, so every morning you’re dashboard will start with a fresh sheet, displaying only the latest incoming emails for the day.
2. Website Performance Dashboard
Another useful data dashboard is a performance display if you own or operate a website.
To create a dashboard that shows you data about your website performance, you’ll need that data in a location that automatically updates. Since Google Sites lets you import charts from Google Sheets, you’ll want to set up Google Sheets to automatically receive data from Google Analytics.
That’s outside of the scope of this article, but we’ve got you covered. There are two ways you can accomplish this. Either set up an IFTTT applet that sends Google Analytics data via email to Google Sheets, or build your own spreadsheet using the Google Core Reporting API.
The reporting API is much more powerful and gives you access to nearly all of the data Google Analytics collects about your website, but it has a slightly steeper learning curve.
Once your spreadsheet is receiving data and you’ve created a few charts that plot your traffic or demographics, you’re ready to build your dashboard.
In Google Sites, just click the Insert menu and select Charts. Browse to the spreadsheet in Google Drive where you’ve saved your spreadsheet, and Google Sites will give you the option to select any of the charts that exist in that spreadsheet.
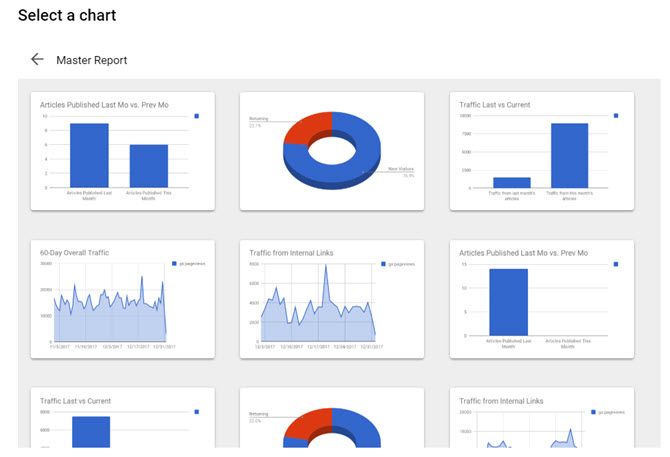
Build your website dashboard by clicking each of the charts you want to include, and place them on the page where you’d like them to go.
In just a few clicks you’ll have a beautiful web performance monitoring dashboard.
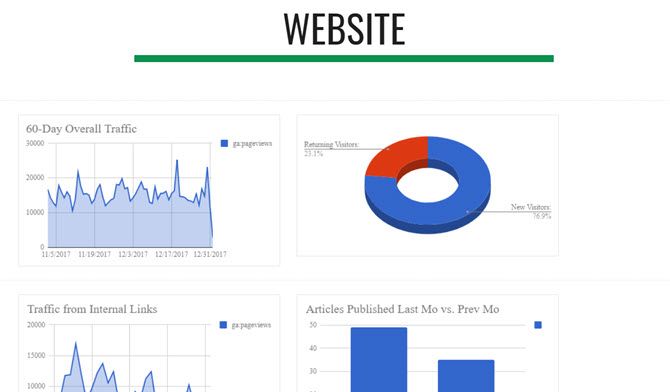
You don’t need an individual Google Site for these different dashboards. You can create sub-pages on the site for each individual dashboard.
This way there’s just one URL to access everything you want to monitor.
3. Time Management Dashboard
If you have several Google Calendars, you can use a time management dashboard that displays three formats of your calendar: Agenda, The Week, and The Month.
Unlike Google Calendar where you have to flip between these views, you can create a Google Sites dashboard that displays them all at once.
Even better, you could embed all the calendars from all of your Google accounts on a single dashboard. Here’s how you do it:
In Google Sites, under Insert, click on Calendar.
This gives you the option to select which Google Calendar you want to insert.
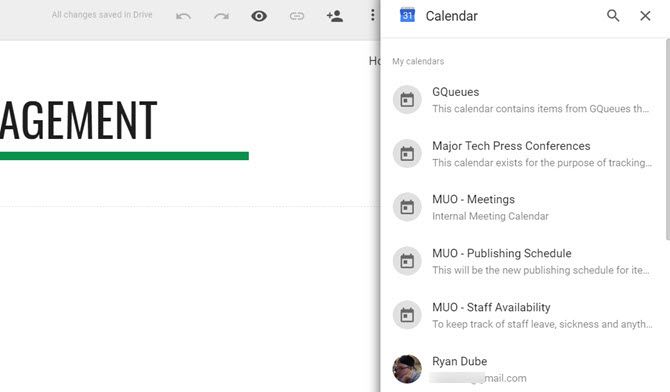
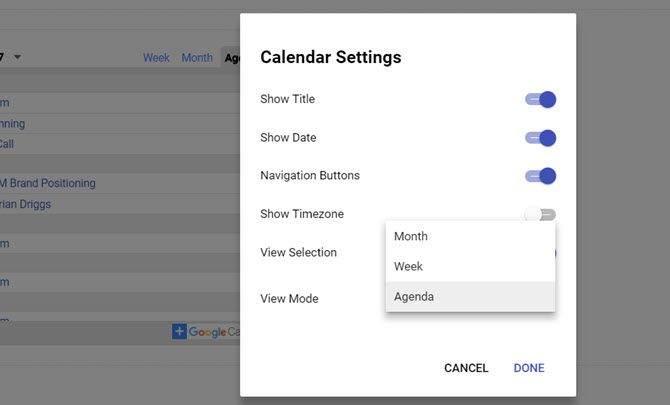
When you select the calendar you want to embed, under View Selection, you can choose from Month, Week, or Agenda.
To create a dashboard with all three, just insert one of these at a time into the dashboard.
Choose a clean layout for the three formats, and you’ll have a highly functional time management dashboard.
Since the Agenda view is so narrow, you could easily fit the Weekly calendar view beside it.
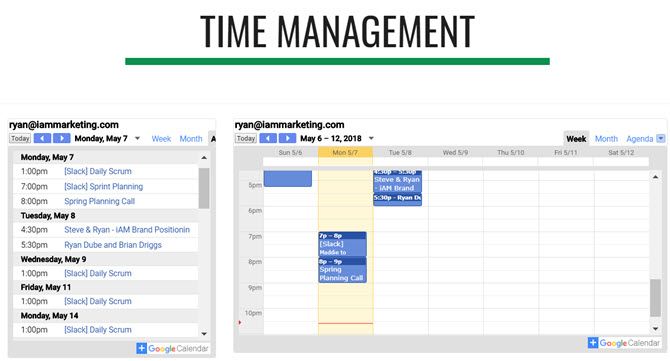
Then, add the larger Monthly calendar view underneath both of those.
Also, you can switch the display mode of each of these widgets on the live dashboard at any time. So you aren’t stuck to a static display after setting it up.
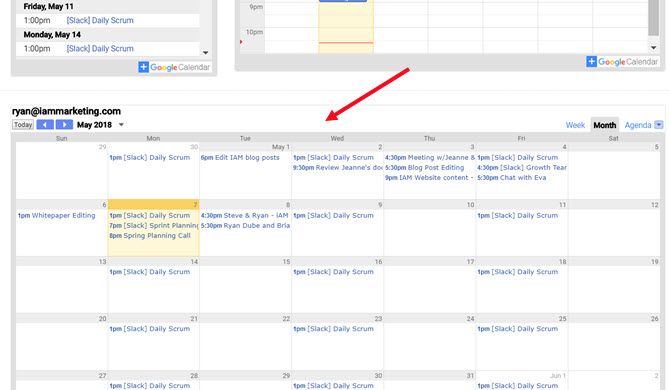
If you want to include calendars from your other Google accounts on the same page, just scroll down to the bottom and start adding more. Or you can create an entirely new sub-page for each Google account.
The layout you choose for your dashboard is completely up to you!
4. Live News Dashboard
If you’ve ever wanted a “mission control” panel with a bunch of displays streaming lots of information at you all at once, Google Sites is the perfect platform to do it.
In the Insert menu, click on YouTube. This brings up a search field where you can find any video on YouTube you may want to embed on your web page.
Most YouTube videos are static though, which would be pretty boring. Luckily there are live news channels on YouTube you can embed. Just search for “live news” or “live” followed by your favorite news network, to find them.
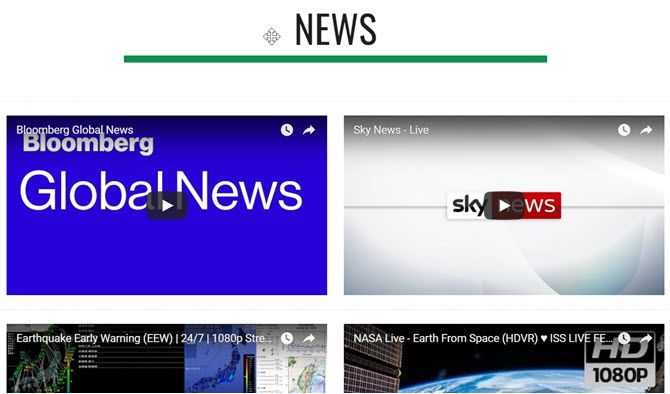
After you’ve embedded all of the live YouTube streams you want to monitor, you can click on each of them to start them playing.
All videos will stream simultaneously on the same page. It looks really cool and will make you feel like you’re sitting at a desk at mission control under Cheyenne Mountain.
5. Dashboard of Places on Google Maps
If you don’t know you can create and share lists in Google Maps, then you’ll want to explore that feature.
It’s a really useful way to keep track of all of your favorite places in organized lists.
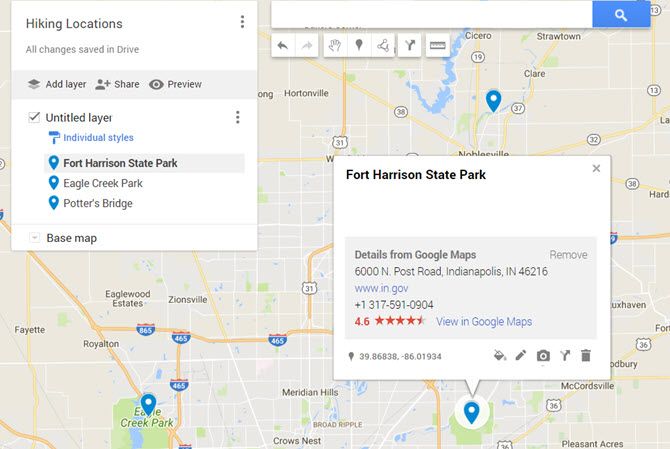
How can you use this to build a Google Sites dashboard? Easy. When you click on the Insert menu in Google Sites and click on Map, you’ll see a menu option called My Maps.
Click on that, and you’ll see all of the lists storing your favorite locations.
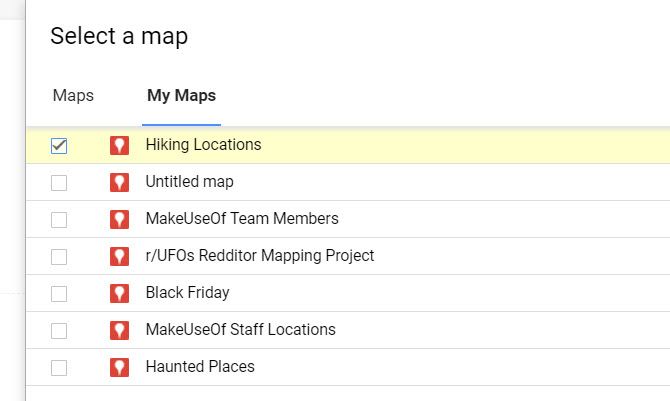
Select one of the lists, and you’ll have an embedded map on your dashboard featuring all of those saved locations.
It’s a really convenient way to store all of your favorite spots on one URL.
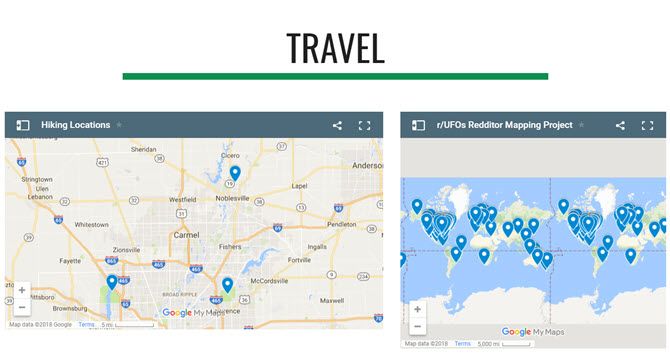
The next time you can’t remember the location of that hiking trail you love to visit, just open up your dashboard and check out your “hiking trails” map.
Switching between all of your dashboards is as simple as clicking the dropdown icon next to Home, and selecting the dashboard you want to see.
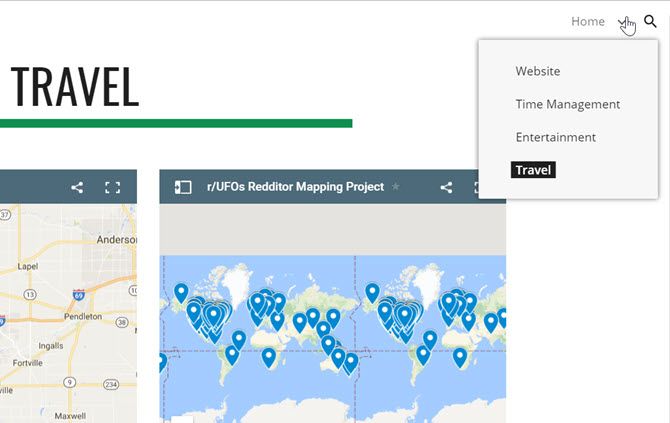
You could even use a dashboard like this to plot out an itinerary for someone and then share the URL with them.
They could access it from any browser or phone, no matter where they are.
Start Using Google Sites Data Dashboards Today
The examples above are just the tip of the iceberg when it comes to building useful dashboards that’ll make your life a whole lot easier.
Just think of all the ways you could incorporate YouTube content, map locations, information from Google Docs or Google Sheets, and more.
Google Sites has always been an easy way to make web pages, but with the new Google Sites, you can actually make beautiful and useful dashboards like these. There’s no need for dedicated data dashboard software.
Read Full Article
No comments:
Post a Comment