
14 January 2020

4 Useful Microsoft Word Tips & Tricks You Should Know About


Microsoft Word is one of the most versatile word-processing software around. Despite its flexibility, you might not know how to take advantage of all of Word’s powerful features.

Unlock the "Essential Microsoft Office Shortcuts" cheat sheet now!

This will sign you up to our newsletter

Enter your Email

Maybe you have no idea how to insert a picture in Word without moving text, or how to create different page numbers for separate sections of your document. Fortunately, Word has solutions for both of these issues and more. These useful Microsoft Word tips and tricks will help you use the program much more efficiently.

1. How to Insert a Picture in Word Without Moving Text

Many people just insert images into a Word document between paragraphs, as this is the easiest and simplest method to embed images in your document. However, once you figure out how to insert a picture in a Word document without moving text, it’ll make formatting your document much simpler.

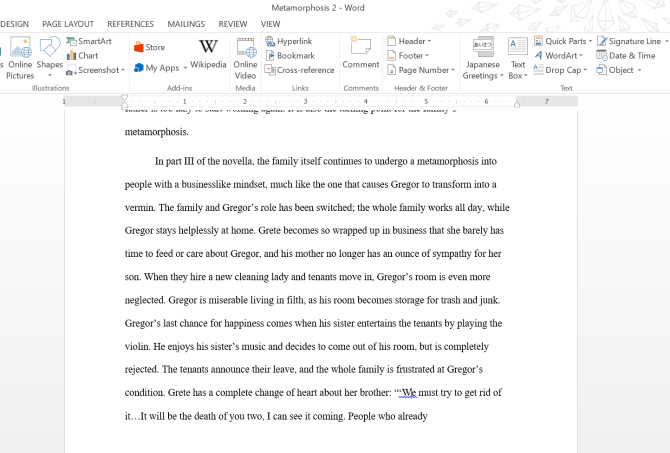
Perhaps you have a Word document formatted in the standard way, as shown here.
Microsoft Word Insert Image Paragraph
If you select Insert > Pictures in the middle of the paragraph, all of the text gets shoved rudely down the page as your inserted image takes over that entire section of the document. To make matters worse, the text gets even more distorted as you try to move the image around.

Learning how to insert an image in Word without moving text with the text wrapping tool will solve this issue.

Microsoft Word Text Wrap Menu

After you insert and select the image, you’ll see a square appear at the top right corner of the image. Select the square to see the Layout Options dropdown menu. You can access this same menu by clicking the image, and selecting Wrap Text under the Format tab.

This is one of the most little known Microsoft Word features, as well as one of the most useful.

The default option, In Line with Text, is the one that you don’t want. As you hover over the options under the With Text Wrapping option, you’ll see six choices, all of which format your picture and text differently:

  • Square: the text moves around your image in a square shape
  • Tight: the text moves around your image, while also conforming to its shape
  • Through: the text will fill in any white spaces in the image itself
  • Top and Bottom: the text appears above and below your image
  • Behind Text: the image gets covered by text
  • In Front of Text: the image covers the text behind it

To insert and freely move a picture in the middle of your text, you can choose either SquareTight, or Through. Just remember that Tight and Through work best with images that have transparent backgrounds.

Microsoft Word Square Text Wrap

For this article, I used the Square option. This makes manipulating the image in between text much easier. Playing around with the text wrapping options can help you figure out which format suits your document the best.

2. Number Pages Within Sections

Page numbers are a Microsoft Word feature you should definitely customize. When writing a multi-part document, you might want to number different sections starting over from one.

This is especially helpful when you want to use Roman numerals for one section and traditional numbering for the rest. Since most people know how to insert page numbers into the header of a document, re-numbering pages within multiple new sections can get tricky.

To get started, pinpoint the section where you want to create a new set of page numbers. You can then select that section with your cursor, head to the Page Layout tab, and click Breaks > Next Page.

Microsoft Word Page Break Next Page

This will separate this section from the rest of your document, and push the text to the next page. On the page following this break, click the header bar to access the Header & Footer Tools tab. Click Link to Previous to deselect it, separating the header or footer from the previous ones.

Microsoft Word Link to Previou Page

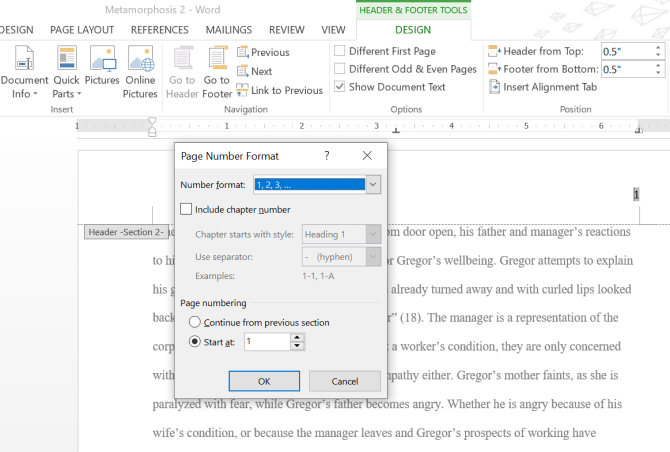
On the same Header & Footer tab, go to Page Number > Format Page Numbers. If you want to change this section’s page numbers to Roman numerals, you can do this by selecting that option from the Number format dropdown menu. To start this section over from page one, hit Start at, and Word will fill in “1” by default.
Microsoft Word Page Number Formatting

After you complete these steps, you’ll have a section with completely separate page numbers.

3. Add Pop-Up Comments for Editing

In addition to all of Word’s useful features, it also lets you collaborate with other users using comments. You can make a comment by highlighting a chunk of text and then selecting Insert > Comment from the menu.
Microsoft Word Comments Insert
You or your reader can reply to a comment by selecting the reply icon on the right side of the comment bubble. When you’re finished reading the comment, right-click it and select Delete Comment to remove it from the document.

You can also select Mark Comment Done to keep the comment, but make it appear greyed out.

Microsoft Word Reply and Delete Comments

4. Researching Selected Text Within Word

For any words that look foreign while reading someone else’s Word document, try using Word’s built-in research feature. All you have to do is highlight the text or phrase, right-click on it, and select Smart Lookup.

Just keep in mind that this feature is only available in Word 2016 and the free, online version of Microsoft Office. For Word 2013, you can use a dictionary add-on or the Search with Bing option to get similar results. In this example, I used Word Online.

Microsoft Word Smart Lookup Feature
Click Smart Lookup, and you’ll notice an entire menu bar that appears on the right side of the screen.

Microsoft Word Smart Lookup Definition

Under the Explore tab, Word displays search results from Bing and related pages from Wikipedia. Click on the Define tab, and Word shows you different meanings of the word from the Oxford Dictionary.

Maximize Your Microsoft Word Productivity

Each of these tips can help you take full advantage of Microsoft Word. They’ll save you from the frustration of trying to figure out how to insert an image in Word without moving text and can help you combat other formatting or research issues with ease.

Want more helpful Microsoft Word tips? Check out these hidden features of Microsoft Word that will make your life easier.

Image Credit: dennizn/Depositphotos

Read the full article: 4 Useful Microsoft Word Tips & Tricks You Should Know About


Read Full Article

15 Excel Formulas That Will Help You Solve Real Life Problems


excel-functions

A lot of people view Microsoft Excel as a tool that’s only useful in business. Truth is, there are a lot of ways it can benefit you at home as well. The key to finding uses of Excel in daily life is picking the right formulas that solve problems.

Unlock the FREE "Essential Excel Formulas" cheat sheet now!

This will sign you up to our newsletter

Enter your Email

Whether you’re shopping for a new car loan, want to figure out which mutual fund investment is best for you, or if you’re just trying to make sense out of your bank account, Excel is a powerful tool that can help.

We picked out 15 formulas that are simple, powerful, and help you solve complex issues.

Financial Formulas

Shopping for a new home and confused by all the mortgage lingo? Looking for a new car and getting confused by the car loan terms the salesperson keeps throwing at you?

Excel Formula Review

Have no fear. Before you take out a loan, do your research with Excel by your side!

1. PMT—Payment

Whenever you’re comparing any loan terms and want to quickly figure out your actual monthly payment given different variations in terms, take advantage of the powerful (and simple) PMT formula.

PMT Excel Formula

Here’s what you need to use this formula:

  • The interest rate of the loan
  • The term of the loan (how many payments?)
  • The starting principle of the loan
  • Future value, if for some reason the loan will be considered paid off before it reaches zero (optional)
  • Type of loan—0 if payments due at the end of each month, or 1 if they’re due at the beginning (optional)

Here’s a cool way to quickly compare a variety of loans to see what your payments will look like. Create an Excel sheet that lists every potential loan and all available information about them. Then, create a “Payments” column and use the PMT formula.

PMT Excel Formula for Interest

Just grab the lower right corner of the PMT cell you just created, and drag it down so it calculates the payment total for all the loan terms listed in the sheet. The Excel autofill feature is one feature you will use a lot with these tricks.

Excel Table for Interest

Now you can compare monthly payments for different kinds of loans.

(A very big thank you to Mark Jones (@redtexture on Twitter) who pointed out that for PMT and FV formulas, you’ve got to be very careful about using the same period—in this case using monthly payments requires dividing the interest term by 12 months)

This is why our readers are so great. Thanks for helping with this fix Mark!

2. FV—Future Value

The next formula comes in handy when you are looking to invest some money into something like a Certificate of Deposit (CD), and you want to know what it will be worth at the end of the term.

Here’s what you need to know to use the FV formula:

  • The interest rate of the loan
  • Number of payments (or investment term in months)
  • The payment for each period (usually monthly)
  • Current starting balance (optional)
  • Type of loan—0 if payments due at the end of each month, or 1 if they’re due at the beginning (optional)

So let’s compare several CDs using the terms that you know from the information the banks have given you. In the example below, let’s say you have a $20,000 inheritance to invest in a CD.

FV Excel Formula

Interest rates are again represented in decimal format (take the interest rate the bank gave you and divide by 100). Payments are zero because CD’s are typically based on a starting value and a future value paid out.  Here’s what the comparison looks like when you use the FV formula for every CD you’re considering.

Future Value Formula for Excel

Without a doubt, the higher interest CD over a longer period of time pays out much more. The only drawback is that you can’t touch any of your money for three whole years, but that’s the nature of investing!

3-4. Logical Formulas—IF and AND

Most banks these days give you the ability to download nearly a year’s worth of bank transactions to a format like CSV. This is a perfect format to analyze your spending using Excel, but sometimes the data you receive from banks is very disorganized.

Using logical formulas are a great way to spot overspending.

Ideally, the bank either automatically categorizes your spending or you’ve set up your account so that things are placed into spending categories. For example, any restaurants we go to get labeled with the DiningOut label.

Spending Categories in Excel

This makes it easy to use a logical formula to identify whenever we’ve gone out to eat and spent over $20.

To do this, just create a logical formula in a new column looking for any value where the category column is “DiningOut” and the transaction column is larger than -$20

Note: The comparison below shows “<“, less than, because the values in column C are all negative.

Here’s what that looks like:

IF AND Formula for Excel

Using IF and AND together in one formula looks tricky, but it’s actually quite simple. The IF statement will output the dollar amount (C2) if the AND statement is true, or FALSE if it isn’t. The AND statement checks whether the category is “DiningOut” and the transaction is greater than $20.

Excel Table for Formula

There you have it! Without having to manually sift through all those transactions, you now know exactly those times when you’ve overspent in a certain category.

Making Sense of Lists

Lists are a big part of everyday life. If you’re managing a household, you’re using lists constantly. Excel has some pretty powerful tools for being productive with checklists, as well as other kinds of list formats.

5-6. COUNT and COUNTIF

Excel can help you quickly organize and sort values is a list.  Let’s take the PTC example. Here’s a list of donations from community members.

COUNT and COUNTIF Formula for Excel

We want to see how many times a person’s name shows up on the list. To do this, you can combine the COUNT formula with an IF formula. First, create a column to check if the person is Michelle or not. The formula will use an IF statement to fill the cell with a “1” if this is true.

IF Formula for Excel

Next, create another column that counts how many times you’ve found Michelle Johnson on the list.

COUNT Formula for Excel

This gives you the count of every place in Column E where there’s a 1 rather than a blank.

Excel Table Result CountIf Formula

So, this is the simplest way to do this kind of thing, but it does require two steps.

6-8. SUMIF, COUNTIF, AVERAGEIF

If you don’t mind using a slightly more advanced formula, you might consider using one of the many combined “IF” formulas like SUMIF, COUNTIF, or AVERAGEIF. These allow you to perform the formula (COUNT, SUM or AVERAGE) if the logical condition is true. Here’s how it works using the above example.

COUNTIF Formula for Excel

This formula looks at column A, which contains all the donor names, and if the cell within the range matches the criteria in quotes, then it counts up by one. This gives you a count of all the times the donor name equals “Michelle Johnson” in a single step.

Excel Table for CountIF Formula

It’s much faster than using two columns, but is a little complex – so use the approach that works best for your situation.

The SUMIF and AVERAGEIF formulas work the very same way, just with different mathematical results. Using SUMIF in this example would give you the total donation dollars for Michelle Johnson if you use it instead.

9. LEN

Another formula that you can use creatively sometimes is the LEN formula. This formula is one of many Excel text formulas that tells you how many characters are in a string of text.

One interesting way to use this in the example above would be to highlight donors who donated over $1,000 by counting the number of digits in the donation column. If the length of the number is 4 or greater, then they donated at least $1,000.

LEN Formula for Excel

Now you can add additional formatting to make it easier on the eyes.

To do this, you need to highlight all the cells in the Donation column, select the Home tab in the menu, and click on Conditional Formatting in the toolbar. Then select Use a formula to determine which cells to format.

Excel Conditional Formatting

Set the range under Format values where this formula is true: to the column/range where all your LEN formula outputs are displayed.

In this example, if you make the condition “>3”, then anything over $1,000 will receive the special formatting. Don’t forget to click the Format… button and choose what kind of special formatting you want for these.

Also, a quick note. You’ll notice my range is defined as “$E2:$E11”, not “$E$2:$E$11”. When you select the range, it defaults to the former, which won’t work. You need to use relative addressing as shown in the picture above. Then, your conditional formatting will work based on the condition of the second range.

Organizing Bank and Financial Downloads

Sometimes, when you download information from businesses—whether it’s your bank, or your health insurance company, the format of the incoming data doesn’t always match what you need it to be.

For example, let’s say that in the exported data from your bank and you’re given the date in the standard format.

Bank Information Excel

If you want to add a new column of your own with your own that’s prefaced by the year and includes the Payee information (for your own sorting purposes), extracting pieces of information from a column is really easy.

10-14. RIGHT, LEFT, TEXT, and CONCATENATE

You can pull the year out of the text in that column using the RIGHT formula.

CONCATENATE Formula for Excel

The formula above is telling Excel to take the text in column D and extract the four characters from the right side. The CONCATENATE formula pieces together those four digits, with the Payee text from column E.

Keep in mind that if you do want to extract text from a date, you will need to convert it to text format (instead of date) using the “=TEXT(D2,”mm/dd/yyyy”)” formula. Then you can use the RIGHT formula to pull out the year.

What if your information is on the left? Well, instead use the LEFT formula and you can pull text from left to right.

CONCATENATE really comes in handy when you have some text from a bunch of different columns that you want to piece together into one long string. There are also a few ways to separate text in Excel if you want to want to learn how to fully manipulate strings.

Picking Random Names from a Hat

15. RANDBETWEEN

One last fun formula is one you may use if you have to do something like pick some names out of a hat for a Christmas party. Put that hat and those scraps of paper away and instead pull out your laptop and launch Excel!

Using the formula RANDBETWEEN, you can have Excel randomly select a number between a range of numbers you specify.

RANDBETWEEN Formula for Excel

The two values you need to use are the lowest and highest numbers, which should be at the ends of the range of numbers you’ve applied to each person’s name.

Once you hit the Enter key, the formula will randomly select one of the numbers within the range.

RANDBETWEEN Formula for Excel

It’s about as random and tamper-proof as you can possibly get. So instead of picking a number from a hat, pick a number from Excel instead!

Using Excel for Everyday Problems

As you can see, Excel isn’t just for data-analysis gurus and business professionals. Anyone can benefit from the many formulas that you’ll find tucked away in Excel. Learn these formulas and you can start solving real-life problems in Excel.

Don’t stop learning Excel. There is a long list of Excel formulas and functions that you can learn to use, you might find some neat little tricks you never thought Excel could do.

Image credit: Goodluz via Shutterstock.com

Read the full article: 15 Excel Formulas That Will Help You Solve Real Life Problems


Read Full Article

The Best Free Music Production Software for Beginners


best-music-prod0soft

Whether you’re starting music production as a hobby or planning to become the next superstar DJ, it’s best to begin with free music production software. Later on, when you evolve into an advanced user, you can switch to premium options that give you more freedom and a greater variety of tools.

In this article we have picked out some of the best free music making software for beginners.

1. GarageBand

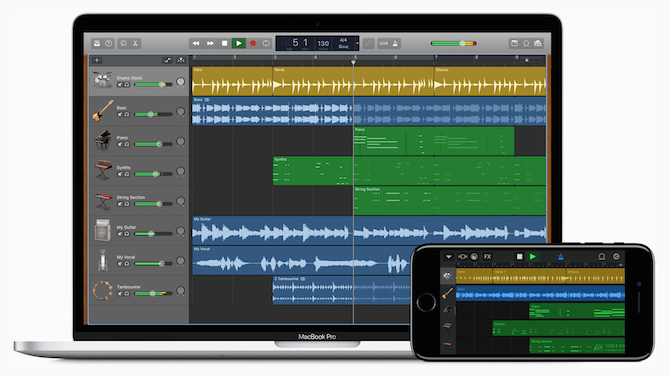
When it comes to beginner-friendly music making software, GarageBand is the number one free option. It’s easy to download from the Mac App Store, and it teaches even beginner musicians how to use some powerful tools.

GarageBand also happens to be one of the easiest platforms to make great music. It allows you to create a song with up to 255 tracks and even offers a virtual session drummer.

GarageBand music editing software

However, even with all its visual simplicity, GarageBand can be rather intimidating for beginners. If you find this free music production software somewhat overwhelming, check out our step-by-step guide to GarageBand.

To speed up your learning process, we recommend installing it on all of your devices (Mac, iPhone, and iPad). ICloud gives you the flexibility to work on your music no matter where you are or which device you’re using.

If at some point you feel you’ve outgrown the free software, you can transfer all of your GarageBand files to Apple’s premium music production offering: Logic Pro.

Download: GarageBand for macOS (Free)

2. DarkWave Studio

DarkWave Studio free Windows music production software

An alternative for PC users, DarkWave Studio is a free music production software that supports Windows 7 or later. It doesn’t need much storage, which is perfect if you plan to use the free software to make music on a laptop (the best laptops for making music).

Although while DarkWave Studio is free, there are a few in-app ads you need to put up with.

This music production software comes with:

  • Virtual Studio
  • Pattern Editor
  • Sequence Editor
  • Multitrack Hard Disk Recorder

Select and edit digital music patterns using the Pattern Editor. The Sequence Editor allows you to line up patterns to play in any arrangement and mix the tracks together. And the Hard Disk Recorder includes recording options for live audio.

DarkWave Studio also includes 19 different plug-ins, which you can use to add virtual effects to your tracks.

With this many options and settings in separate windows, DarkWave Studio may seem a little difficult to use at first. However, you can find plenty of tutorials and support online, making this one of the best free music making software programs for beginners.

Download: DarkWave Studio for Windows (Free)

3. Audacity

Audacity free music editing software

Unlike the software we already covered, Audacity is a digital audio editor, not a digital audio workstation. Its main purpose is manipulating audio data rather than helping you organize different audio tracks into a coherent whole. You can read more about the difference in our comparison of Audacity and GarageBand.

Audacity lets you edit samples, process audio files, and export music as a wide range of formats, including MP3, WAV, or AIFF. It’s great if you’re looking for free music production software to put together beats and samples for songs.

Take a look at the best free DAW software for Windows if you need something more powerful.

The interface is simple to use, yet at the same time, the variety of effects and settings can be tough to wrap your head around. It might take you a few days to get comfortable with everything.

Audacity is available for download on Windows, macOS, and Linux. It’s one of the most popular music production software options and a great way to get started making music for free.

Download: Audacity for Windows | macOS | Linux

4. LMMS

LMMS (which used to stand for Linux MultiMedia Studio) is a cross-platform music production software, available on macOS, Windows, and Linux. It’s suitable for all kinds of music production and is a great free software option for beginners.

LMMS has multiple different windows to help you create music. Edit melodies in the Piano Roll and create a rhythm section with the Beat+Bassline Editor. Get an overview of your structure in the Song Editor, then mix everything together with the FX Mixer. You can even automate effects and volume using the Automation Editor.

LMMS has a wide variety of instrument synthesizers, so it’s a great piece of software to make music for free.

Among other good qualities of LMMS is its compatibility with third-party apps. The program supports VST and LADSPA plug-ins with which you can mix a multitude of extra effects into the music track.

When your music is ready, export it as MP3, AIFF, and WAV, or transfer files to different music production software.

Download: LMMS for Windows | macOS | Linux

5. Tracktion T7

Tracktion T7 was once a premium music production software. Rather than drop T7 when the next software came out, Tracktion decided to give it away completely free, making it one of the most feature-packed options on this list.

There are no track limits, plugin limitations, or 30-day trials with Tracktion T7. The clean, single-window interface is easy to wrap your head around, while still packing in a lot of different features.

You can use Tracktion T7 to edit audio, compose MIDI, add effects, and automate different instrument parameters. It gives you everything you need to start making music.

Tracktion T7 works on Windows, macOS, and Linux. If you get on well with the free software, you can always upgrade to Tracktion Waveform. This has even more features, including Groove Doctor, Subtractive Synthesizer, and Celemony Melodyne Essential.

Register for a free account on the Tracktion website to download Tracktion T7 to your computer.

Download: Tracktion T7 for Windows | macOS | Linux

6. Cakewalk by BandLab

Cakewalk by BandLab demo track

Just like Tracktion T7, Cakewalk SONAR used to be a paid software that you can now get for free. It’s all thanks to BandLab buying Cakewalk in 2018.

Rebranded as Cakewalk by BandLab, this free music making software benefits from over 30 years of development. It’s another powerful option that you can use to compose, record, edit, mix, master, and share your music.

Add unlimited audio or MIDI tracks using its award-winning user interface. Then take advantage of Cakewalk’s VST3 software instruments and studio-quality effects, like convolution reverb and dynamic compression.

Cakewalk by BandLab is only available to Windows users. It’s compatible with Windows 7 and later, so long as your computer runs on 64-bit architecture. BandLab recommends you use a computer with at least a multi-core Intel processor and 4GB of RAM.

To get it, you first need to sign up for and install BandLab. Then you can choose the instrument and effects packs to download with Cakewalk SONAR using the Bandlab app.

Download: Cakewalk by BandLab for Windows

Find the Free Music Production Software for You

This list is only the tip of the iceberg. There’s a huge variety of free music making software out there. Researching and reading about other people’s experiences with it can help, but the best way to find your favorite option is by trying some of them out.

When you’re ready to move on to the next level, you’ll probably notice a bigger difference by buying a better computer for music production rather than upgrading your software. Especially since so many of the options on this list offer everything you need already.

Read the full article: The Best Free Music Production Software for Beginners


Read Full Article

JPEG2000


JPEG2000

Have we hit peak smartphone?


Last Halloween, we broke down some “good news” from a Canalys report: the smartphone industry saw one-percent year-over-year growth — not exactly the sort of thing that sparks strong consumer confidence.

In short, 2019 sucked for smartphones, as did the year before. After what was nearly an ascendant decade, sales petered off globally with few exceptions. Honestly, there’s no need to cherrypick this stuff; the numbers this year have been lackluster at best for a majority of companies in a majority of markets.

For just the most recent example, let’s turn to a report from Gartner that dropped late last month. The numbers focus specifically on the third quarter, but they’re pretty indicative of what we’ve been seeing from the industry of late, with a 0.4 percent drop in sales. It’s a fairly consistent story, quarter after quarter for a couple of years now.


Read Full Article

Have we hit peak smartphone?


Last Halloween, we broke down some “good news” from a Canalys report: the smartphone industry saw one-percent year-over-year growth — not exactly the sort of thing that sparks strong consumer confidence.

In short, 2019 sucked for smartphones, as did the year before. After what was nearly an ascendant decade, sales petered off globally with few exceptions. Honestly, there’s no need to cherrypick this stuff; the numbers this year have been lackluster at best for a majority of companies in a majority of markets.

For just the most recent example, let’s turn to a report from Gartner that dropped late last month. The numbers focus specifically on the third quarter, but they’re pretty indicative of what we’ve been seeing from the industry of late, with a 0.4 percent drop in sales. It’s a fairly consistent story, quarter after quarter for a couple of years now.


Read Full Article
Google brings IBM Power Systems to its cloud


As Google Cloud looks to convince more enterprises to move to its platform, it needs to be able to give businesses an onramp for their existing legacy infrastructure and workloads that they can’t easily replace or move to the cloud. A lot of those workloads run on IBM Power Systems with their Power processors and until now, IBM was essentially the only vendor that offered cloud-based Power systems. Now, however, Google is also getting into this game by partnering with IBM to launch IBM Power Systems on Google Cloud.

“Enterprises looking to the cloud to modernize their existing infrastructure and streamline their business processes have many options,” writes Kevin Ichhpurani, Google Cloud’s corporate VP for its global ecosystem in today’s announcement. “At one end of the spectrum, some organizations are re-platforming entire legacy systems to adopt the cloud. Many others, however, want to continue leveraging their existing infrastructure while still benefiting from the cloud’s flexible consumption model, scalability, and new advancements in areas like artificial intelligence, machine learning, and analytics.”

Power Systems support obviously fits in well here, given that many companies use them for mission-critical workloads based on SAP and Oracle applications and databases. With this, they can take those workloads and slowly move them to the cloud, without having to re-engineer their applications and infrastructure. Power Systems on Google Cloud is obviously integrated with Google’s services and billing tools.

This is very much an enterprise offering, without a published pricing sheet. Chances are, given the cost of a Power-based server, you’re not looking at a bargain, per-minute price here.

Since IBM has its own cloud offering, it’s a bit odd to see it work with Google to bring its servers to a competing cloud — though it surely wants to sell more Power servers. The move makes perfect sense for Google Cloud, though, which is on a mission to bring more enterprise workloads to its platform. Any roadblock the company can remove works in its favor and as enterprises get comfortable with its platform, they’ll likely bring other workloads to it over time.


Read Full Article

13 January 2020

Using Machine Learning to “Nowcast” Precipitation in High Resolution


The weather can affect a person’s daily routine in both mundane and serious ways, and the precision of forecasting can strongly influence how they deal with it. Weather predictions can inform people about whether they should take a different route to work, if they should reschedule the picnic planned for the weekend, or even if they need to evacuate their homes due to an approaching storm. But making accurate weather predictions can be particularly challenging for localized storms or events that evolve on hourly timescales, such as thunderstorms.

In “Machine Learning for Precipitation Nowcasting from Radar Images,” we are presenting new research into the development of machine learning models for precipitation forecasting that addresses this challenge by making highly localized “physics-free” predictions that apply to the immediate future. A significant advantage of machine learning is that inference is computationally cheap given an already-trained model, allowing forecasts that are nearly instantaneous and in the native high resolution of the input data. This precipitation nowcasting, which focuses on 0-6 hour forecasts, can generate forecasts that have a 1km resolution with a total latency of just 5-10 minutes, including data collection delays, outperforming traditional models, even at these early stages of development.

Moving Beyond Traditional Weather Forecasting
Weather agencies around the world have extensive monitoring facilities. For example, Doppler radar measures precipitation in real-time, weather satellites provide multispectral imaging, ground stations measure wind and precipitation directly, etc. The figure below, which compares false-color composite radar imaging of precipitation over the continental US to cloud cover imaged by geosynchronous satellites, illustrates the need for multi-source weather information. The existence of rain is related to, but not perfectly correlated with, the existence of clouds, so inferring precipitation from satellite images alone is challenging.
Top: Image showing the location of clouds as measured by geosynchronous satellites. Bottom: Radar image showing the location of rain as measured by Doppler radar stations. (Credit: NOAA, NWS, NSSL)
Unfortunately, not all of these measurements are equally present across the globe. For example, radar data comes largely from ground stations and is generally not available over the oceans. Further, coverage varies geographically, and some locations may have poor radar coverage even when they have good satellite coverage.

Even so, there is so much observational data in so many different varieties that forecasting systems struggle to incorporate it all. In the US, remote sensing data collected by the National Oceanic and Atmospheric Administration (NOAA) is now reaching 100 terabytes per day. NOAA uses this data to feed the massive weather forecasting engines that run on supercomputers to provide 1- to 10-day global forecasts. These engines have been developed over the course of the last half century, and are based on numerical methods that directly simulate physical processes, including atmospheric dynamics and numerous effects like thermal radiation, vegetation, lake and ocean effects, and more.

However, the availability of computational resources limits the power of numerical weather prediction in several ways. For example, computational demands limit the spatial resolution to about 5 kilometers, which is not sufficient for resolving weather patterns within urban areas and agricultural land. Numerical methods also take multiple hours to run. If it takes 6 hours to compute a forecast, that allows only 3-4 runs per day and resulting in forecasts based on 6+ hour old data, which limits our knowledge of what is happening right now. By contrast, nowcasting is especially useful for immediate decisions from traffic routing and logistics to evacuation planning.

Radar-to-Radar Forecasting
As a typical example of the type of predictions our system can generate, consider the radar-to-radar forecasting problem: given a sequence of radar images for the past hour, predict what the radar image will be N hours from now, where N typically ranges from 0-6 hours. Since radar data is organized into images, we can pose this prediction as a computer vision problem, inferring the meteorological evolution from the sequence of input images. At these short timescales, the evolution is dominated by two physical processes: advection for the cloud motion, and convection for cloud formation, both of which are significantly affected by local terrain and geography.
Top (left to right): The first three panels show radar images from 60 minutes, 30 minutes, and 0 minutes before now, the point at which a prediction is desired. The right-most panel shows the radar image 60 minutes after now, i.e., the ground truth for a nowcasting prediction. Bottom Left: For comparison, a vector field induced from applying an optical flow (OF) algorithm for modeling advection to the data from the first three panels above. Optical flow is a computer vision method that was developed in the 1940s, and is frequently used to predict short term weather evolution. Bottom Right: An example prediction made by OF. Notice that it tracks the motion of the precipitation in the bottom left corner well, but fails to account for the decaying strength of the storm.
We use a data-driven physics-free approach, meaning that the neural network will learn to approximate the atmospheric physics from the training examples alone, not by incorporating a priori knowledge of how the atmosphere actually works. We treat weather prediction as an image-to-image translation problem, and leverage the current state-of-the-art in image analysis: convolutional neural networks (CNNs).

CNNs are usually composed of a linear sequence of layers, where each layer is a set of operations that transform some input image into a new output image. Often, a layer will change the number of channels and the overall resolution of the image it’s given, in addition to convolving the image with a set of convolutional filters. These filters are themselves small images (for us, they are typically only 3x3, or 5x5). Filters drive much of the power of CNNs, and result in operations like detecting edges, identifying meaningful patterns, etc.

A particularly effective type of CNN is the U-Net. U-Nets have a sequence of layers that are arranged in an encoding phase, in which layers iteratively decrease the resolution of the images passing through them, and then a decoding phase in which the low-dimensional representations of the image created by the encoding phase are expanded back to higher resolutions. The following figure shows all of the layers in our particular U-Net.
(A) The overall structure of our U-NET. Blue boxes correspond to basic CNN layers. Pink boxes correspond to down-sample layers. Green boxes correspond to up-sample layers. Solid lines indicate input connections between layers. Dashed lines indicate long skip connections transversing the encoding and decoding phases of the U-NET. Dotted lines indicate short skip connections for individual layers. (B) The operations within our basic layer. (C) The operations within our down-sample layers. (D) The operations within our up-sample layers.
The input to the U-Net is an image that contains one channel for each multispectral satellite image in the sequence of observations over the last hour. For example, if there were 10 satellite images collected in the last hour, and each of those multispectral images was taken at 10 different wavelengths, then the image input for our model would be an image with 100 channels. For radar-to-radar forecasting, the input is a sequence of 30 radar observations over the past hour, spaced 2 minutes apart, and the output contains the prediction for N hours from now. For our initial work in the US, we trained a network from historical observations over the continental US from the period between 2017 and 2019. The data is split into periods of four weeks, where the first three weeks of each period are used for training and the fourth week is used for evaluation.

Results
We compare our results with three widely used models. First, the High Resolution Rapid Refresh (HRRR) numerical forecast from NOAA. HRRR actually contains predictions for many different weather quantities. We compared our results to their 1-hour total accumulated surface precipitation prediction, as that was their highest quality 1-hour precipitation prediction. Second, an optical flow (OF) algorithm, which attempts to track moving objects through a sequence of images. This latter approach is often applied to weather prediction even though it makes the assumption that overall rain quantities over large areas are constant over the prediction time — an assumption that is clearly violated. Third, the so-called persistence model, is the trivial model in which each location is assumed to be raining in the future at the same rate it is raining now, i.e. the precipitation pattern does not change. That may seem like an overly simplistic model to compare to, but it is common practice given the difficulty of weather prediction.
A visualization of predictions made over the course of roughly one day. Left: The 1-hour HRRR prediction made at the top of each hour, the limit to how often HRRR provides predictions. Center: The ground truth, i.e., what we are trying to predict. Right: The predictions made by our model. Our predictions are every 2 minutes (displayed here every 15 minutes) at roughly 10 times the spatial resolution made by HRRR. Notice that we capture the general motion and general shape of the storm.
We use precision and recall (PR) graphs to compare the models. Since we have direct access to our own classifier, we provide a full PR curve (seen as the blue line in the figure below). However, since we don’t have direct access to the HRRR model, and since neither the persistence model nor OF have the ability to trade-off precision and recall, those models are represented only by individual points. As can be seen, the quality of our neural network forecast outperforms all three of these models (since the blue line is above all of the other model’s results). It is important to note, however, that the HRRR model begins to outperform our current results when the prediction horizon reaches roughly 5 to 6 hours.
Precision and recall (PR) curves comparing our results (solid blue line) with: optical flow (OF), the persistence model, and the HRRR 1-hour prediction. As we do not have direct access to their classifiers, we cannot provide a full PR curve for their results. Left: Predictions for light rain. Right: Predictions for moderate rain.
One of the advantages of the ML method is that predictions are effectively instantaneous, meaning that our forecasts are based on fresh data, while HRRR is hindered by computational latency of 1-3 hours. This leads to better forecasts for computer vision methods for very short term forecasting. In contrast, the numerical model used in HRRR can make better long term predictions, in part because it uses a full 3D physical model — cloud formation is harder to observe from 2D images, and so it is harder for ML methods to learn convective processes. It's possible that combining these two systems, our ML model for rapid forecasts and HRRR for long-term forecasts, could produce better results overall, an idea at the focus of our future work. We're also looking at applying ML directly to 3D observations. Regardless, immediate forecasting is a key tool for real-time planning, facilitating decisions and improving lives.

Acknowledgements
Thanks to Carla Bromberg, Shreya Agrawal, Cenk Gazen, John Burge, Luke Barrington, Aaron Bell, Anand Babu, Stephan Hoyer, Lak Lakshmanan, Brian Williams, Casper Sønderby, Nal Kalchbrenner, Avital Oliver, Tim Salimans, Mostafa Dehghani, Jonathan Heek, Lasse Espeholt, Sella Nevo, Avinatan Hassidim.